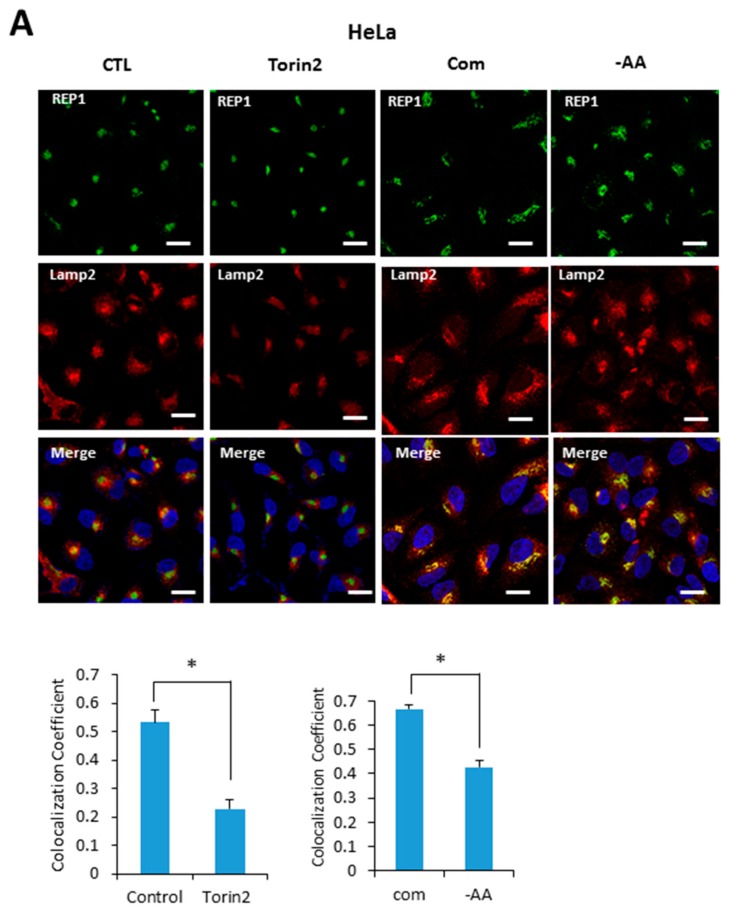
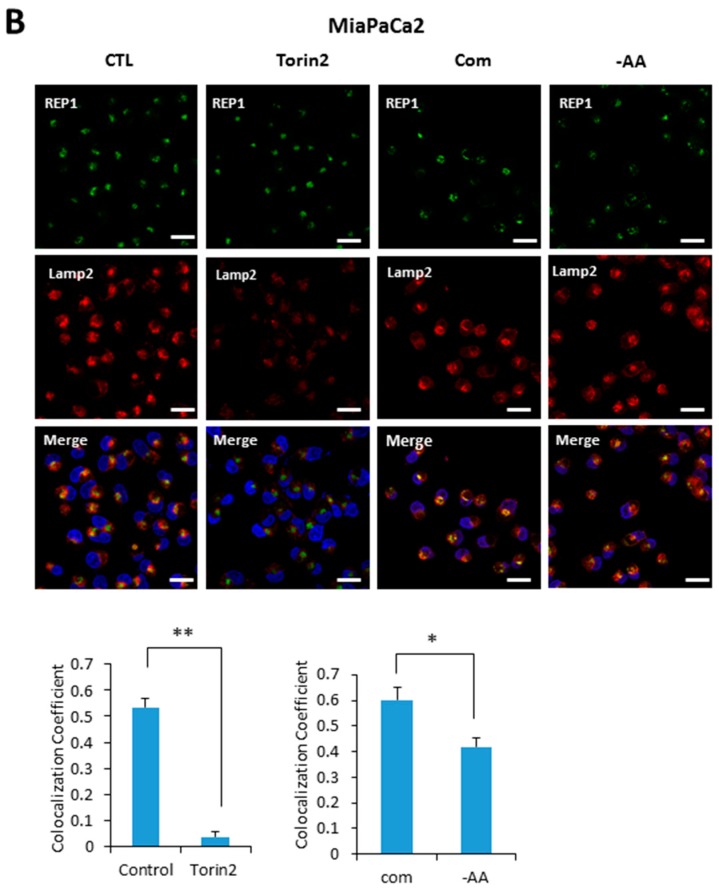
Figure 5.
REP1localization is affected by nutrient status and mTOR activity. (A) Hela and (B) MiaPaCa2 cells were plated and incubated for 24 h, which were further incubated in treatment with Torin2 at 20 nM or replaced with amino acid-deplete media for 4 h. Then the cells were stained with a lysotracker and intracellular fluorescent signals were analyzed by fluorescence microcopy. Co-localization levels were presented as a co-localization coefficient based on image quantification, described in materials and methods. Error bars indicate mean +/− standard error for n = 3 independent experiments. Statistical significance was determined via Student’s t-test; * p < 0.05.


