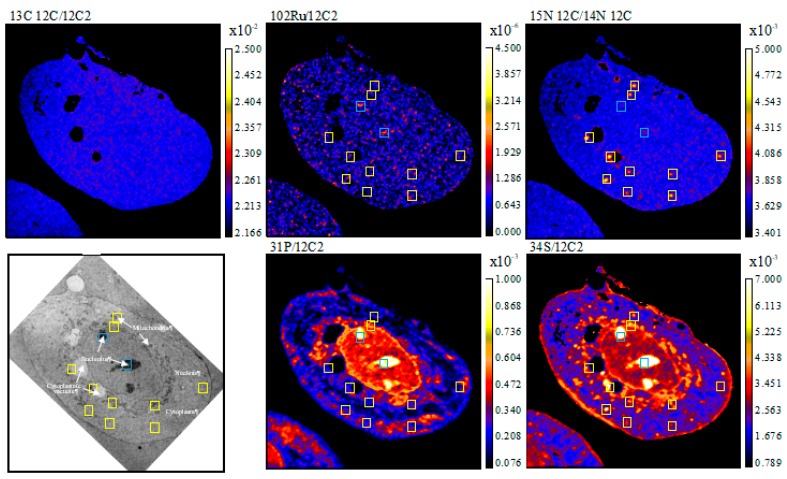
Figure 2.
NanoSIMS secondary ion maps of 31P−/12C2−, 34S−/12C2−, 14N12C−/12C2−, 15N12C−/14N12C−, 102Ru−/12C2−, and 13C12C−/12C2− and TEM of MCF-7 cells treated with 15N and 13C-labelled RAPTA-T (500 μM, 24 h). Blue boxes indicate Ru enriched hotspots, yellow boxes indicate 15N enriched hotspots and green boxes indicate hotspots co-enriched with 15N and Ru. Cellular organelles are labeled in the TEM image.

