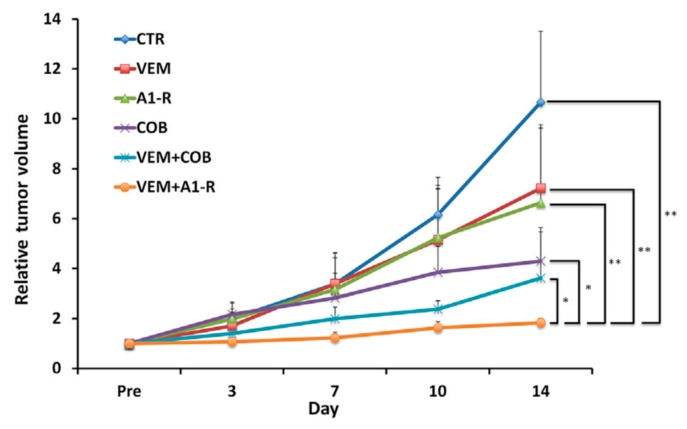
Figure 5.
Tumor growth curves of the treated and untreated BRAF-V600E mutant melanoma PDOX. Line graph shows tumor volume at each point relative to the initial tumor volume. Please see Materials and Methods section for drug dose, route and schedule. ** p < 0.01, * p < 0.05. Error bars = SD [9].

