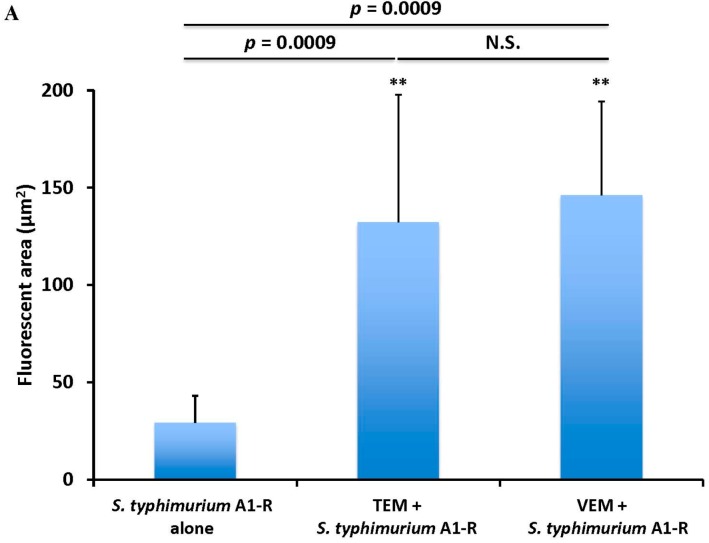
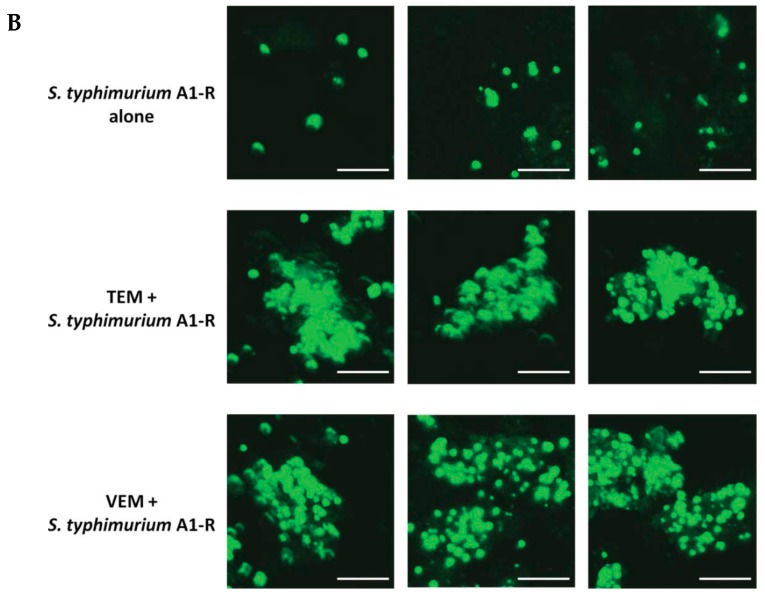
Figure 7.
(A) Quantitative tumor targeting by S. typhimurium A1-R-GFP alone and in combination with chemotherapy on the BRAF-V600E mutant melanoma PDOX model. Bar graph shows S. typhimurium A1-R-GFP fluorescent area (mm2) for each treatment group. N.S. = not significant. Error bars = SD [57]; (B) fluorescence imaging of S. typhimurium A1-R-GFP targeting alone and in combination with chemotherapy in the melanoma PDOX. Confocal imaging with the FV1000. Scale bars: 12.5 μm.


