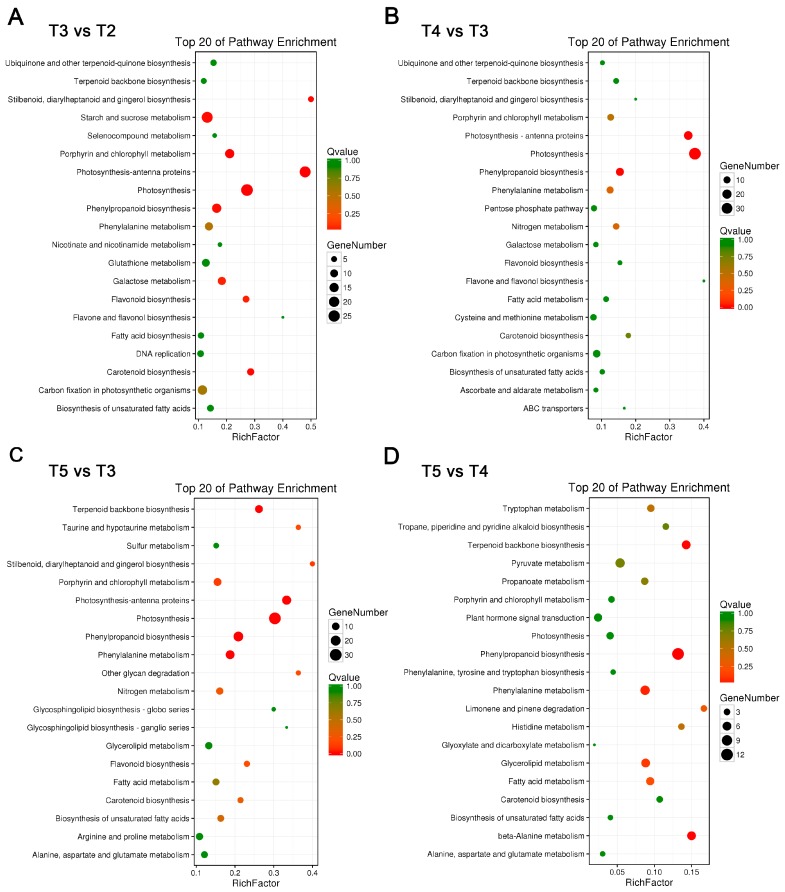
Figure 4.
Enrichment of metabolic pathways at different tepal development and pigmentation stages. (A–D) Statistics of pathway enrichment in: T3 vs. T2 (A); T4 vs. T3 (B); T5 vs. T3 (C); and T5 vs. T4 (D) tepal transcriptome comparisons. The top 20 enriched pathways based on q-values in each comparison and the number of unigenes in each pathway are shown.

