Figure 2.
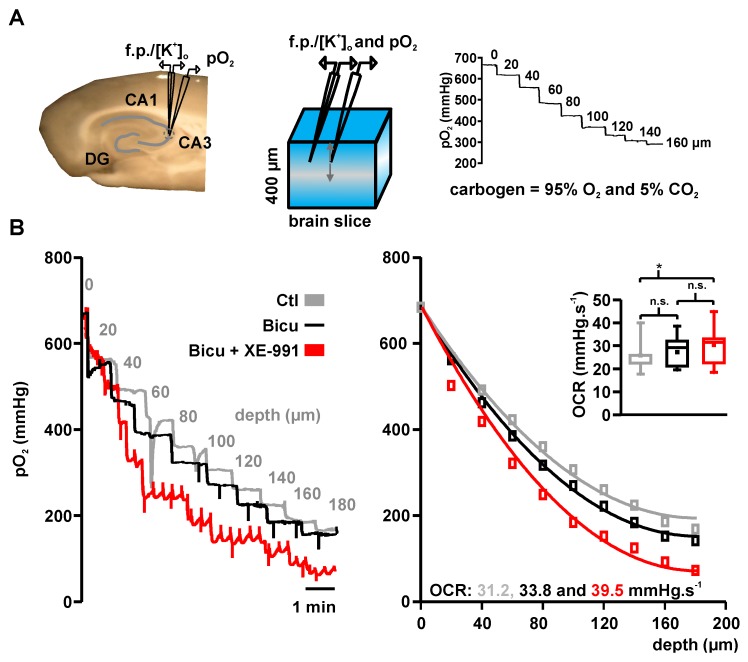
Variations in basal pO2 under bicuculline and bicuculline + XE-991: (A) Left: Picture and scheme of typical electrode placement in acute hippocampal slice. Double-barreled ion-sensitive microelectrodes (with field potential and ion-sensitive recording side) and Clark-style oxygen electrodes were placed ~80 µm below the slice surface in the pyramidal layer of area CA3. Acute brain slices receive oxygen from surface and bottom and the partial oxygen pressure (pO2) decreases with the distance to the source of oxygen (i.e., distance to the slice bottom and surface) providing typical depth profiles (see right, numbers in trace—distance to slice surface). The oxygen gradient along the slice depends on oxygen supply and solubility, which are both constant under experimental conditions. Hence, changes in pO2 depth profiles reflect activity-dependent O2 consumption; and (B) Using an established reaction-diffusion model, peak pO2-levels at each vertical step in the pO2 profile (left) were fitted (right) to calculate oxygen consumption rates (OCR). OCRs increased from control (spontaneous activity, gray, 31.2 mmHg·s−1) to induced ILEs (black, 33.8 mmHg·s−1) and SLEs (red, 39.5 mmHg·s−1) in this example. The quantitative analysis (inset) revealed a significant OCR increase during SLEs (red) compared with control conditions (gray, * p = 0.008, n.s. not significant, n = 8, paired t-test with Bonferroni post-hoc correction).

