Figure 3.
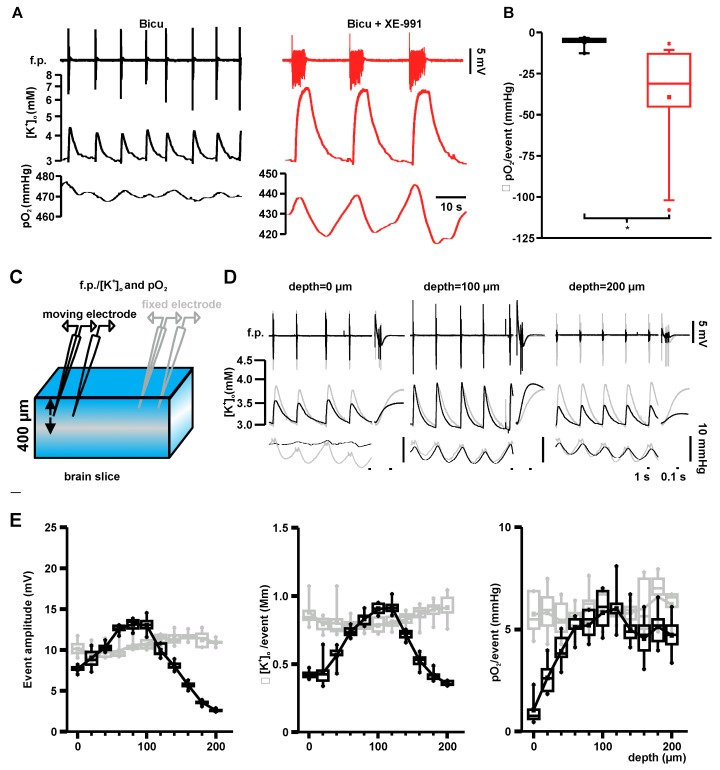
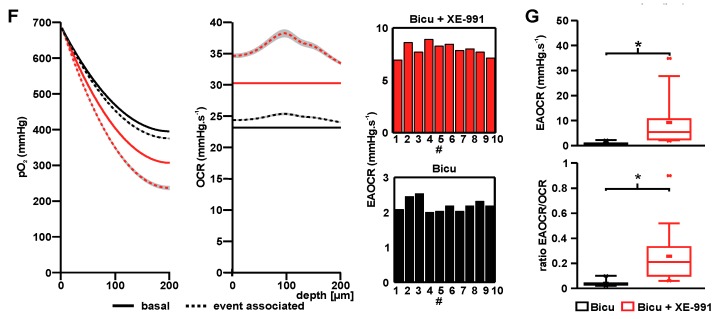
Locality of activity and modeling of local oxygen consumption rates associated with ILEs and SLEs in brain slices: (A) Typical f.p., extracellular potassium ([K+]o) and oxygen recordings of ILEs (black) and SLEs (red). Event-associated oxygen baseline drops were larger in SLEs compared with ILEs; (B) Local oxygen drops during ILEs and SLEs at 80 µm from the slice surface. Event-related pO2 drops during SLEs (red) were significantly larger compared with ILEs (black) (p = 0.011, n = 8 and 15 for ILEs and SLEs respectively, independent t-test); (C) Scheme of brain slice recordings under interface conditions with two pairs of double-barreled potassium-sensitive microelectrodes and Clark-style oxygen electrodes. One pair of electrodes was moved in vertical steps through the pyramidal layer in area CA3 (moving electrode). A second stationary pair of electrodes was placed in close vicinity at ~80 µm below the slice surface (fixed electrode) to control for signal stability; (D) Overlay of the recording signals from the two pairs of electrodes (black: moving electrode, grey: fixed electrode) during bicuculline-induced ILEs. F.p., [K+]o and oxygen drops remained stable at the fixed electrode, while f.p. amplitudes and [K+]o peaks were larger at 100 µm compared with 0 and 200 µm at the moving electrode. Oxygen dips increased from 0 to 100 µm and remained large at a depth of 200 µm in the moving electrode; (E) ILE-associated amplitudes, event-related peak potassium levels and pO2-drops at different depths along the slice. Field potential and potassium levels showed a very similar amplitude distribution with a peak around 100 µm. Oxygen drops were smaller near the surface, but remained stable after 60–80 µm (gray—fixed electrode, black—moving electrode); (F) Fitted basal pO2-depth profiles (left, solid line) and event-associated depth profiles (left, dashed line) for bicuculline (black) and bicuculline + XE-991 (red). Basal OCRs (solid line, right graph) and depth-dependent event-associated OCRs (EAOCR, dotted line, right graph, EAOCR = OCR/event (mmHg·s−1)). Bar plots show EAOCRs for ten individual events; and (G) EAOCR (top) and ratio of EAOCR to basal OCR (bottom) during ILEs and SLEs. During SLEs (red) EAOCRs were significantly higher compared with EAOCRs during ILEs (black; p = 0.016, n = 8 and 15 for ILEs and SLEs; independent t-test). The ratio comparing EAOCRs to the basal OCR was significantly higher under SLEs compared with ILEs (p = 0.035, n = 8 and 15 for ILEs and SLEs, respectively, independent t-test).


