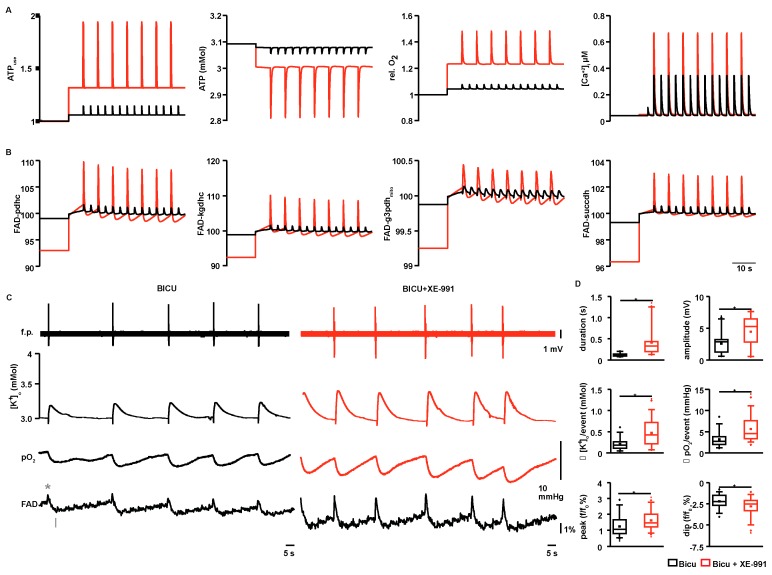
Figure 4.
Modeling of basal and event-associated ATP consumption rates, ATP levels and FAD reduction states associated with ILEs and SLEs: (A) Basal ATP consumption increased by 6% and 32% compared with control during bicuculline (black) and bicuculline + XE-991 (red) application, which decreased cellular ATP levels to 3.08 mM and 3.0 mM. Event associated ATP consumption was higher under SLEs (~94% above control) compared with ILEs (~15% above control) and associated with a decrease in cellular ATP level to 3.05 mM and 2.81 mM. The third plot summarizes the relative changes in basal OCR and EAOCR (see also Figure 2B and Figure 3G). Intracellular Ca2+ transients are shown on the right; (B) FAD reduction states for FAD bound to pyruvate dehydrogenase complex (pdhc), α-ketogluterate dehydrogenase complex (kgdhc), mitochondrial glycerol-3-phosphate dehydrogenase (g3pdhmito), and succinate dehydrogenase (succdh). Single events elicit increased FAD oxidation in all enzymes, with a higher peak value for SLEs compared with ILEs. In order to emphasize changes in event-associated FAD redox states, ILEs and SLEs were aligned, by manually shifting the baseline; (C) Simultaneous f.p., [K+]o, pO2 and FAD-autofluorescence recording during ILEs (black) and SLEs (red). Under submerged conditions event amplitudes were smaller, yet morphologically similar to interface conditions (Figure 1 and Figure 2). Event duration, [K+]o peaks and local pO2 drops increased during SLEs compared with ILEs. Simultaneously recorded FAD-transients showed increased oxidation, which was predicted by the model. Importantly, the data used for modeling was based on recordings under interface conditions; and (D) Quantification for C. Similar to interface conditions, SLEs showed significantly increased event durations, [K+]o-rises and local oxygen drops (top and middle). In contrast with interface conditions, f.p. event amplitudes increased from ILEs to SLEs (top). As predicted by the computational model, event-related FAD-transients, i.e., FAD peaks (see asterisk in C) and dips (see arrow in C), were significantly enhanced (bottom). * p < 0.05, n = 90 individual ILEs and 114 SLEs, independent t-test.

