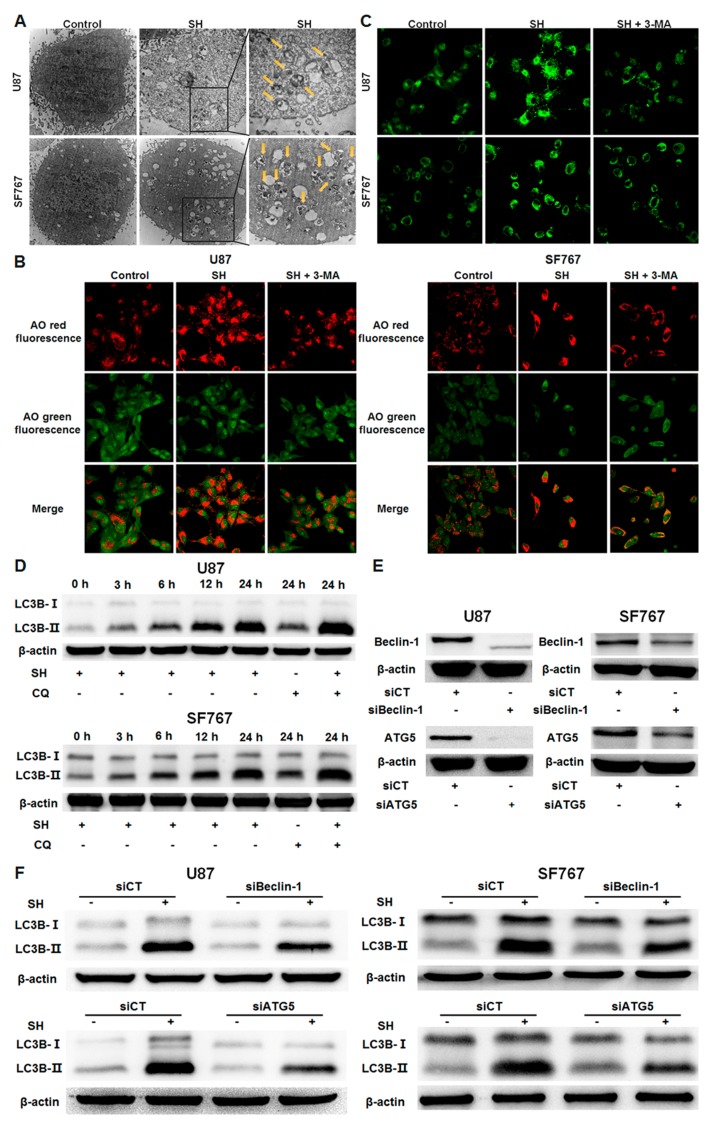
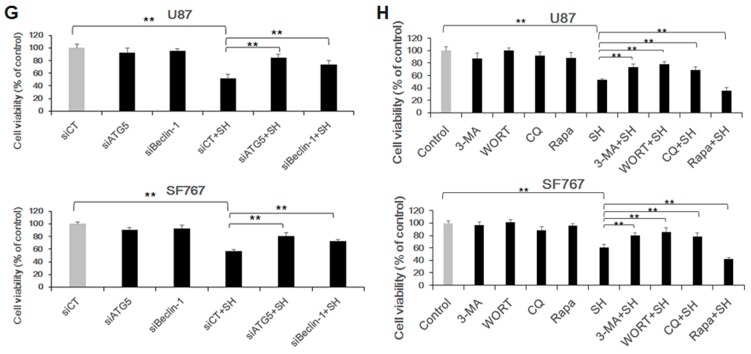
Figure 2.
SH inhibits human glioblastoma cell viability through autophagy. (A) Representative transmission electron micrographs indicating the ultrastructure of U87 and SF767 cells. Various types of autophagic vesicles (arrowheads) are found within the cytoplasm in the two cell lines treated with SH (0.5 mM) for 24 h; (B) After 24 h of SH treatment (0.5 mM) in the presence or absence of 3-MA, the two cell lines were stained with AO and observed via confocal microscopy. AO produces red fluorescence in acidic autophagic vacuoles, and green fluorescence in cytoplasm and nucleus; (C) After 24 h of SH treatment (0.5 mM) in the presence or absence of 3-MA, the two cell lines were stained with MDC and imaged via confocal microscopy; (D) Effects of SH on LC3B-II levels in human glioblastoma cells. U87 and SF767 cells were treated with SH (0.5 mM) and/or CQ for the indicated times; (E) Efficiency of Beclin-1 and ATG5 knockdown. (F) Effects of ATG5 or Beclin-1 siRNA on SH-mediated autophagy. U87 and SF767 cells were transfected with a no-target control siRNA (siCT), ATG5 siRNA (siATG5), or Beclin-1 siRNA (siBeclin-1) for 24 h and then treated with or without SH (0.5 mM) for another 24 h; (G) Effects of ATG5 or Beclin-1 siRNA on SH-mediated inhibition of human glioblastoma cell proliferation; (H) Effects of autophagy inhibitors or activators on the SH-induced inhibition of human glioblastoma cell growth. Each image is representative of n = 3 experiments. The results shown in (D–F) are representative Western blots, n = 3, and β-actin served as the loading control. All data are shown as the mean ± SEM, n = 3. ** p < 0.01, versus the control or SH treatment alone.


