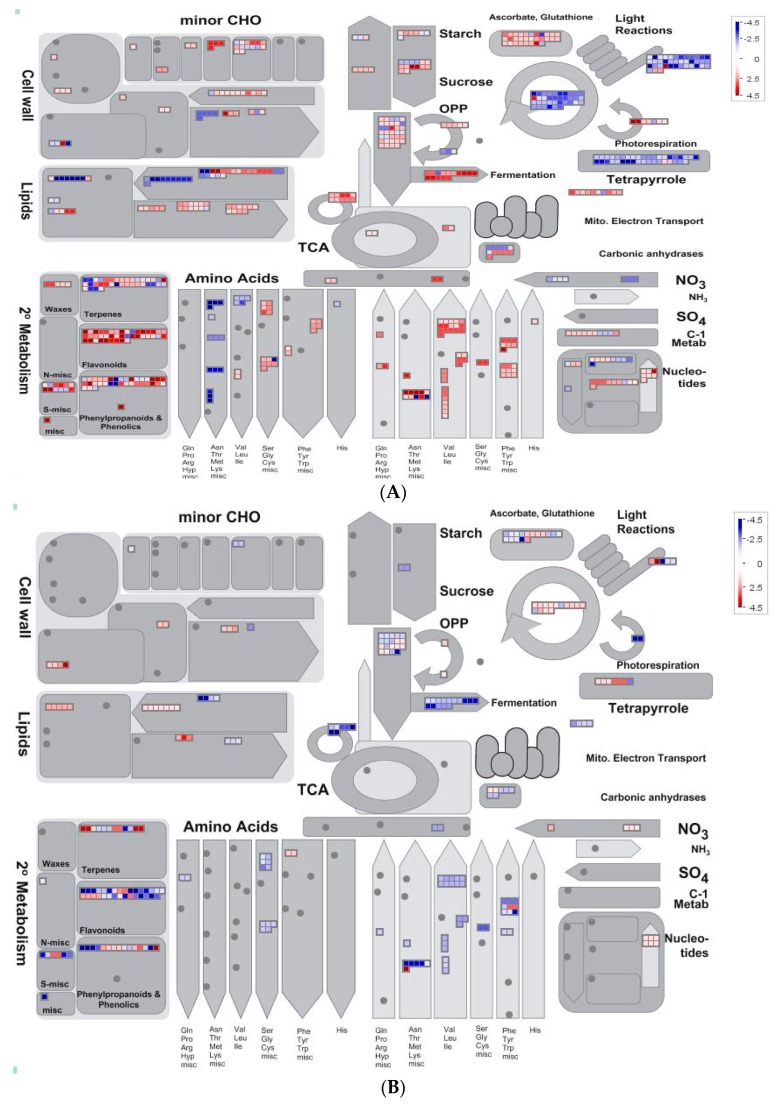
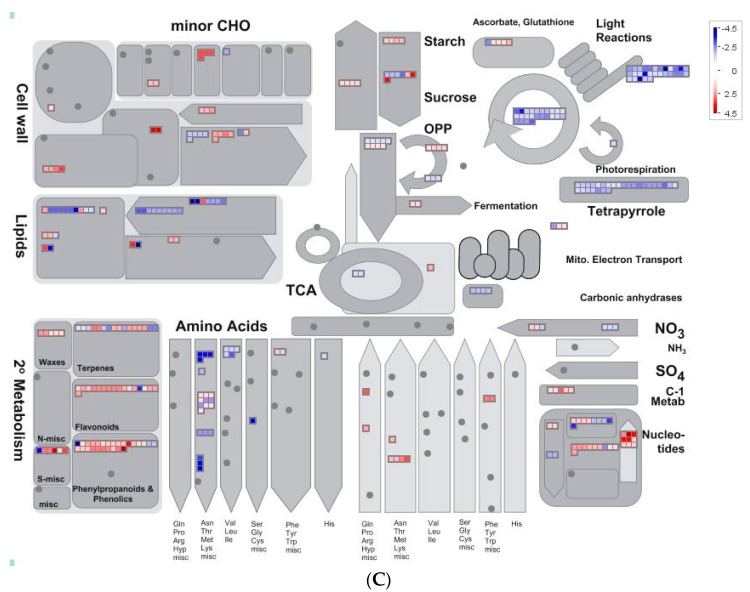
Figure 6.
Overview of differentially expressed genes involved in various metabolic processes under different treatments. (A) Q vs. control; (B) Q + SA vs. Q; and (C) Q + SA vs. control. The images were obtained using MapMan, showing different functional categories that passed the cutoff (less than 0.05 q value and greater than two-fold change) for differential expression. The red color represents up-regulated genes, and the blue color represents down-regulated genes.


