
Figure 1.
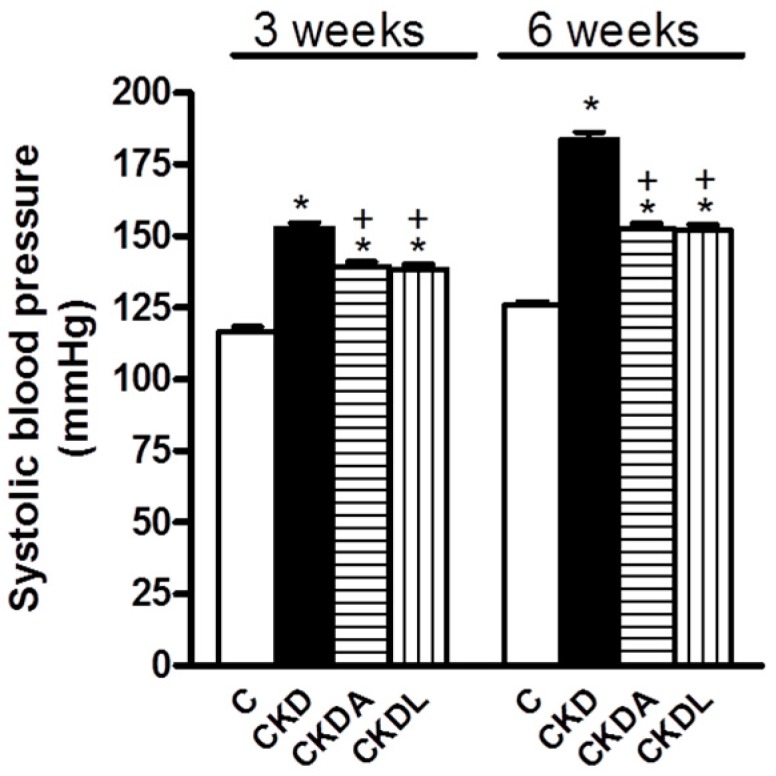
Systolic blood pressure at three and six weeks of follow-up. Control, C; chronic kidney disease, CKD; chronic kidney disease, allicin-treated, CKDA; and chronic kidney disease, losartan-treated, CKDL. Values represent mean ± SEM, n = 6. * p < 0.05 versus C; + p < 0.05 versus CKD.