Figure 3.
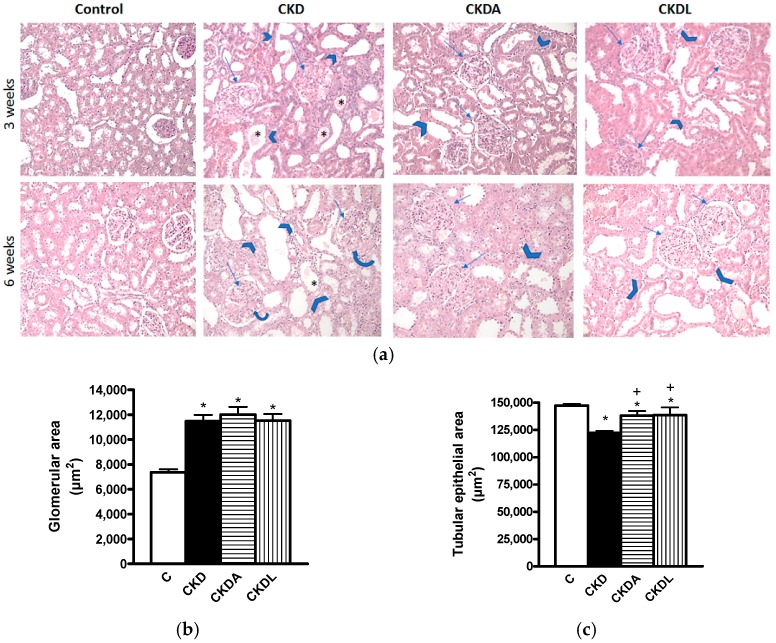
Representative microphotographs of the kidney cortexes of animals subjected to subtotal renal ablation for the induction of CKD at three weeks (upper images) and six weeks (lower images) of follow-up (a). Quantitative analysis of glomerular area (b); and tubular epithelial area (c) at six weeks of follow-up. Controls (C) show no histological abnormalities. The chronic kidney disease group (CKD) shows glomerular (arrows) changes as mesangial expansion and fibrosis and shows tubular (arrow heads) lesions as lumen size augmentation, epithelial thinning, and the presence of hyaline casts (*). The allicin-treated (CKDA) and losartan-treated (CKDL) groups’ images demonstrate a clear amelioration of these glomerular and tubular changes. (HE, original magnifications 100×). Data are expressed as mean ± SEM, n = 6. * p < 0.05 versus C; + p < 0.05 versus CKD.

