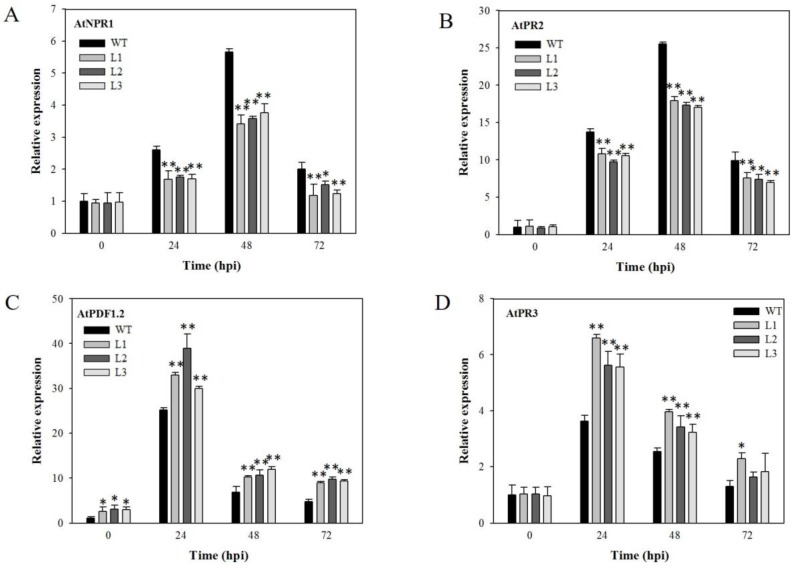
Figure 8.
Relative expression levels of disease-resistance-related genes in VaSTS19-expressing lines and nontransgenic control plants after PstDC3000 infection. The expression levels of (A) AtNPR1; (B) AtPR2; (C) AtPDF1.2 and (D) AtPR3. Measurements were done using qRT-PCR. Values are the means ± SD from three independent experiments (n = 5). Asterisks indicate statistically significant difference (Student’s t test, * 0.01 < p < 0.05, ** p < 0.01) between transgenic lines and nontransgenic control plants.

