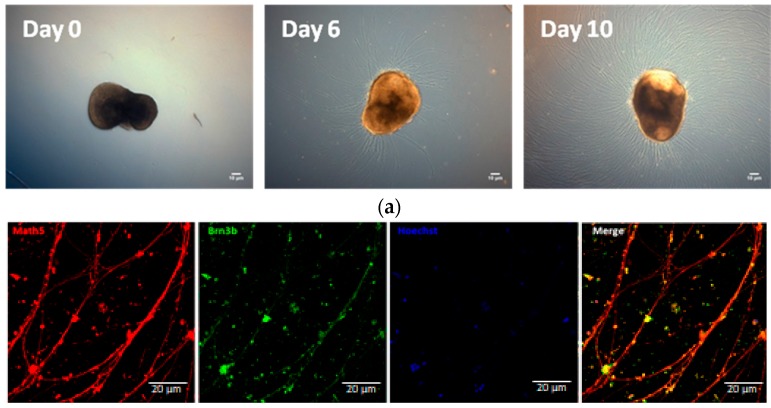
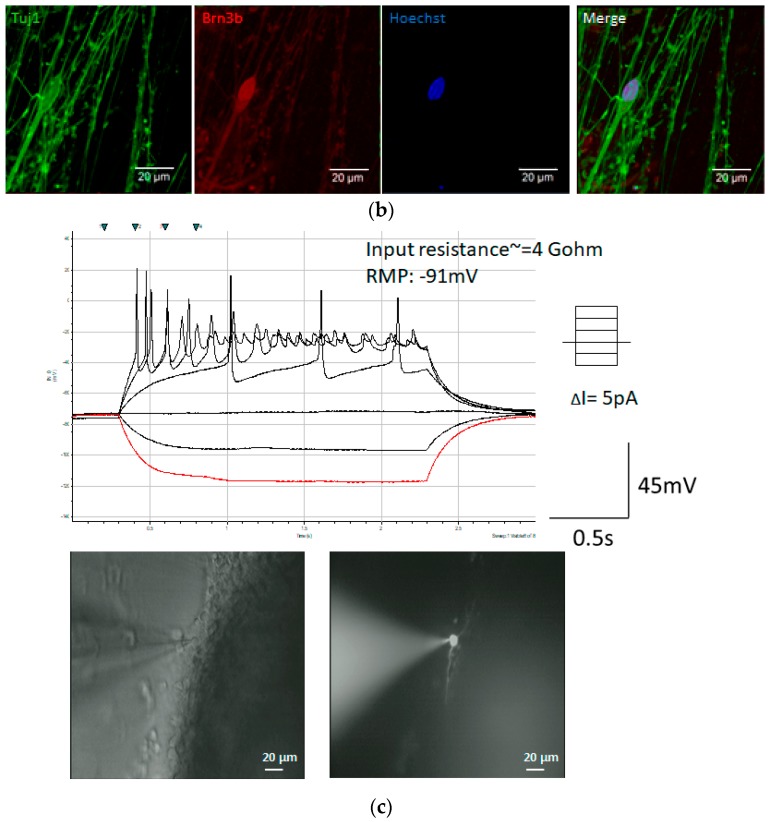
Figure 2.
RGC neurite outgrowth from optic vesicles. (a) Images of RGCs after dissociation from optic vesicles from Day 0 to Day 10. hiPSC-derived RGC displayed long axon-like structure. Scale bar = 10 μm; (b) the hiPSC-derived cells were stained by RGC specific markers, Math5, and Brn3b as well as the marker of neural cytoskeleton, Tuj1; (c) RGCs of Day 20 were filled with Rhodamin under fluorescence illumination (bottom panel). The complete I-V curve was analyzed by patch clamp. The red line shows the response of the first current injected into the cell and black lines indicate the response of the other different currents to the cells (up panel). The firing pattern of action potentials showed in the middle column, suggesting that RGCs became mature after isolation for 20 days.


