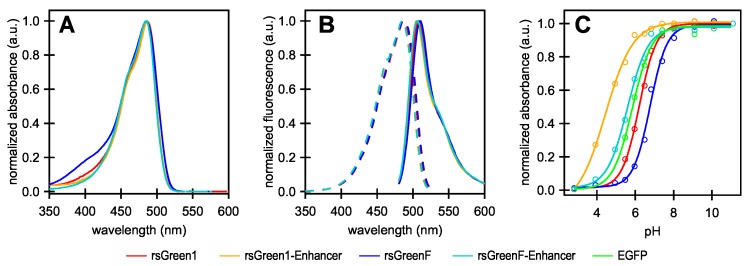
Figure 1.
Absorption, excitation and emission spectra of rsGreens and Enhancer constructs. (A) Normalized absorbance spectra; (B) excitation (dashes) and emission (solid) spectra; (C) pH titration curves showing the absorption maximum at different pH values of the indicated labels. All graphs were normalized to their maximum absorption, excitation or emission. EGFP: enhanced green fluorescent protein; a.u.: arbitrary units.

