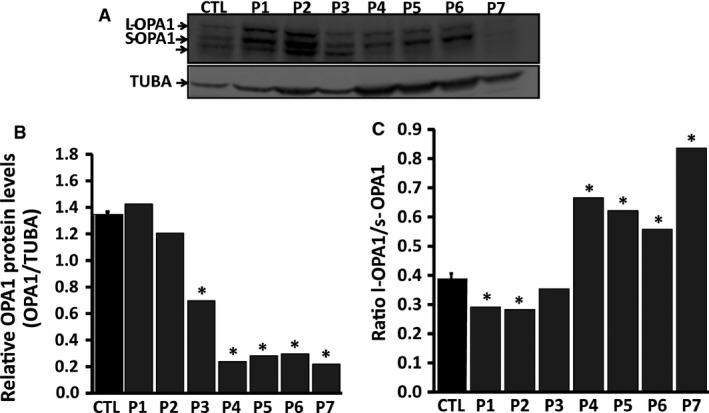
Figure 1.

Immunoblot analysis of OPA1 expression in OPA1 mutant fibroblasts and controls. The protein extracts were obtained from primary cell cultures. Cells were directly quenched with the same buffer as used for cell lysis (see Materials and methods) at 4°C to avoid cleavage of long‐OPA1 into short‐OPA1 isoforms. (A) Immunoblot bands of OPA1 protein. (B) Densito‐metrical analysis of the protein bands shown in A); the figure shows ratios of densities of the protein band to densities of the corresponding tubulin alpha band (TUBA) bands. (C) The figure shows ratios of the long (l‐OPA1) to the short (s‐OPA1) OPA1 isoforms. Data obtained from six independent experiments were analysed. P1‐P7: patients; CTL: controls.
