
Figure 2.
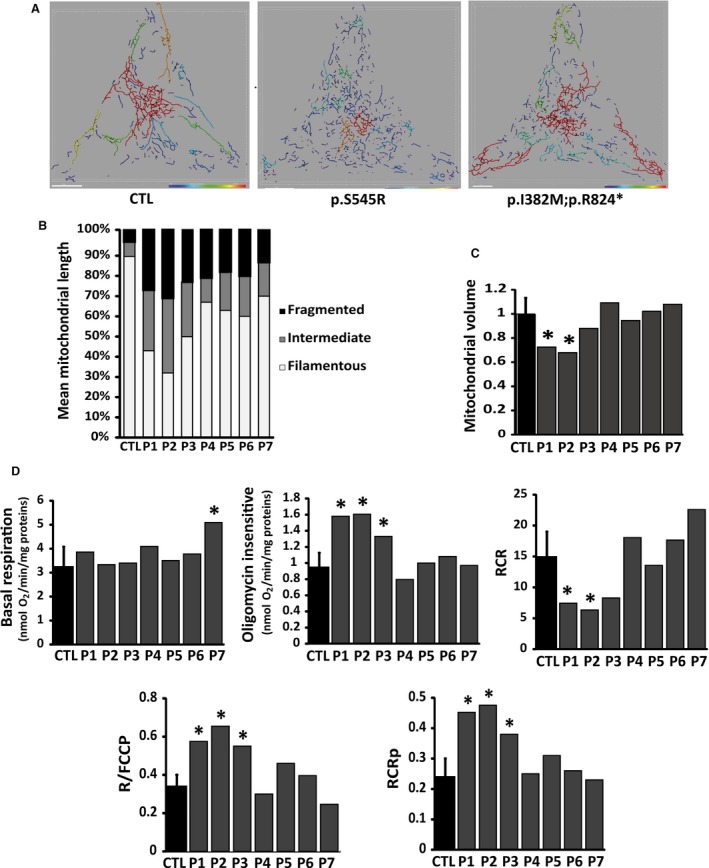
Morphology of mitochondrial network and bioenergetics in control and OPA1 mutated fibroblasts. Cell volumes and shapes were standardized using micropatterned coverslips. Mitochondrial lengths were assessed and colour‐coded (e.g. the red colour represents mitochondria >20 μm). (A) Fibroblasts were incubated in 2/3 Dulbecco's modified Eagle medium and 1/3 Amniomax for 48 hrs, and then loaded with MitoTracker Red as described in Materials and methods. Representatives of 5–10 similar images are shown for each cell line. Scale bar = 10 μm. (B) Bar graphs show the distribution of the mitochondrial population in three different categories on the basis of mitochondrial morphology: ‘filamentous’, mitochondria >20 μm; ‘intermediate’, mitochondria 5–20 μm; and ‘fragmented’, mitochondria <5 μm. (C) Bar graphs show mitochondrial volume quantified as described in Materials and methods. Data were obtained from three independent experiments. (D) Mitochondrial oxidative phosphorylation was analysed on control (CTL) and OPA1 mutated fibroblasts. Oxygen consumption was measured under basal conditions (Basal respiration graph), in the presence of oligomycin (4 μg/ml) (oligomycin‐insensitive respiration graph), and in the presence of FCCP (4 mM). The respiratory control ratio (RCR graph) was calculated as the ratio of the FCCP‐uncoupled to the oligomycin‐insensitive respiration. Respiration coupled to ATP production (RCRp graph) was calculated as the ratio of the difference between the rates of basal and oligomycin‐insensitive respiration to the uncoupled FCCP respiration. Respiratory reserve capacity was calculated as the ratio of basal respiration to the FCCP‐uncoupled respiration (R/FCCP graph). Data obtained from six independent experiments were analysed. P1‐P7: patients; CTL: controls.