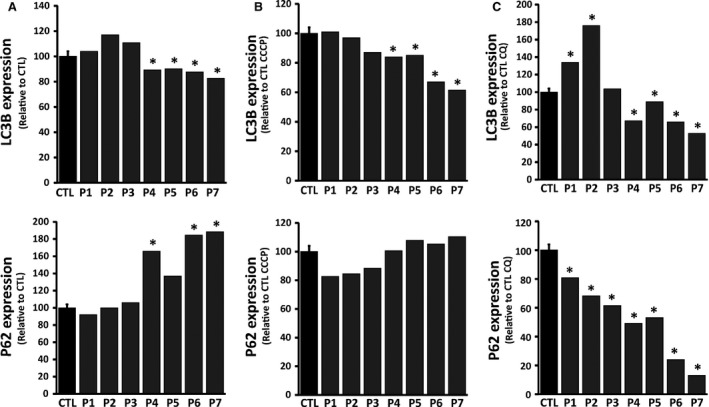
Figure 3.

Immunoblot analysis of autophagic response proteins in OPA1 mutated fibroblasts and controls. Levels of autophagy levels were assessed by quantitative analysis of autophagy markers LC3II and P62 in total cell lysates from cells incubated under normal conditions (DMSO) or pre‐treated with either 60 μM chloroquine (4 hrs) or with 10 μM CCCP (24 hrs) using Western Blot analysis. (A–C) The results, represented as LC3II conversion (LC3I/total LC3I+II) and P62, show ratios of protein band densities to the densities of the respective tubulin alpha bands (TUBA) (See Fig. S4). To modulate and test efficiency in these cell lines, control and OPA1 mutated fibroblasts were incubated in presence of either DMSO (A), a mitochondrial uncoupler CCCP (B), or the autophagy inhibitor chloroquine (C). Data obtained from five independent experiments were analysed. P1‐P7: patients; CTL: controls.
