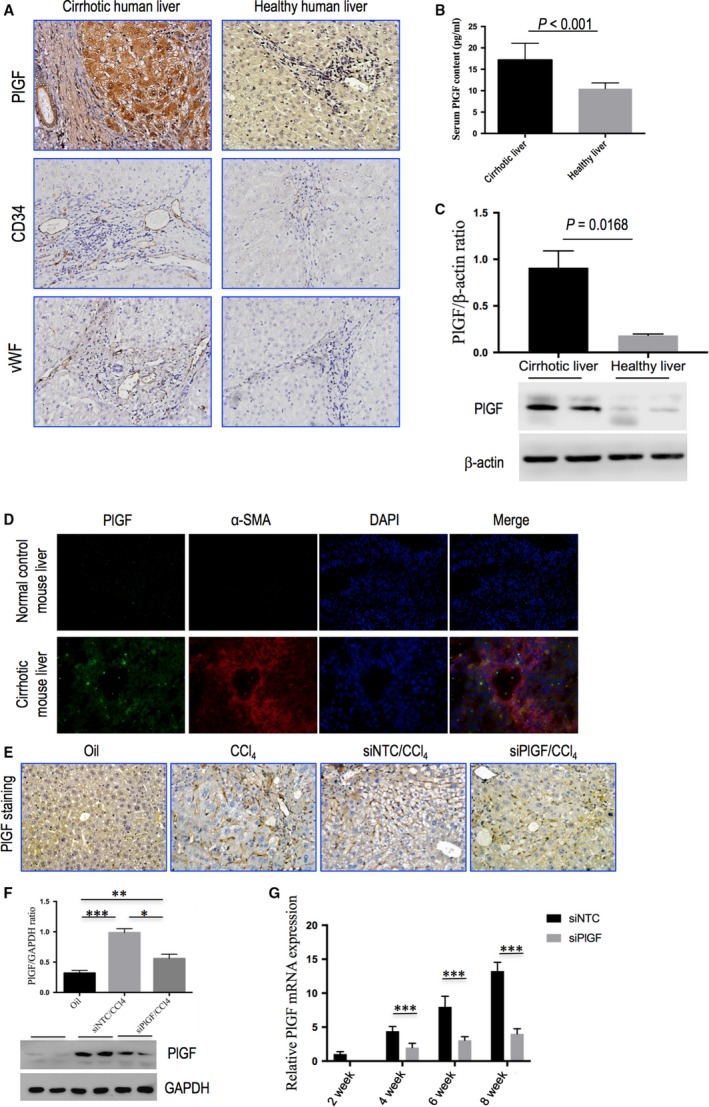
Figure 2.

PlGF expression is up‐regulated in the CCl4‐induced rodent model of liver cirrhosis as well as in patients with cirrhosis, and PlGF in fibrotic liver is suppressed by system delivery in vivo PlGF siRNA. (A) Immunohistochemical staining of PlGF, CD34 and vWF in human liver samples (original magnification: ×200). (B) Serum PlGF contents examined by ELSA. (C) Western blot analysis of human cirrhotic PlGF expression and β‐actin as loading control (n = 3). (D) Representative images of double immunofluorescence of PlGF and α‐SMA in livers from each group of mice. Cell nuclei (blue) fluorescent staining was performed using DAPI. Colocalization of α‐SMA (red) and PlGF (green) is shown in merge panel. Original magnification: ×400. (E) Representative microscopy images of PlGF immunohistochemistry in livers from each group of mice (original magnification: 200×). (F) Western blotting analysis of PlGF expression in lysed liver tissue of each group at 8 weeks. Fibrotic mice treated with PlGF siRNA (siPlGF) or NTC siRNA (siNTC), with results normalized relative to the expression of GAPDH (n = 3). (G) Quantitative RT‐PCR comparing relative levels of PlGF mRNA expression in liver tissues following 2, 4, 6, and 8 weeks of CCl4 administration. The expression was normalized against GAPDH. Gene expression folds are presented as fold increase over 2‐week mice (before siRNA injection).
