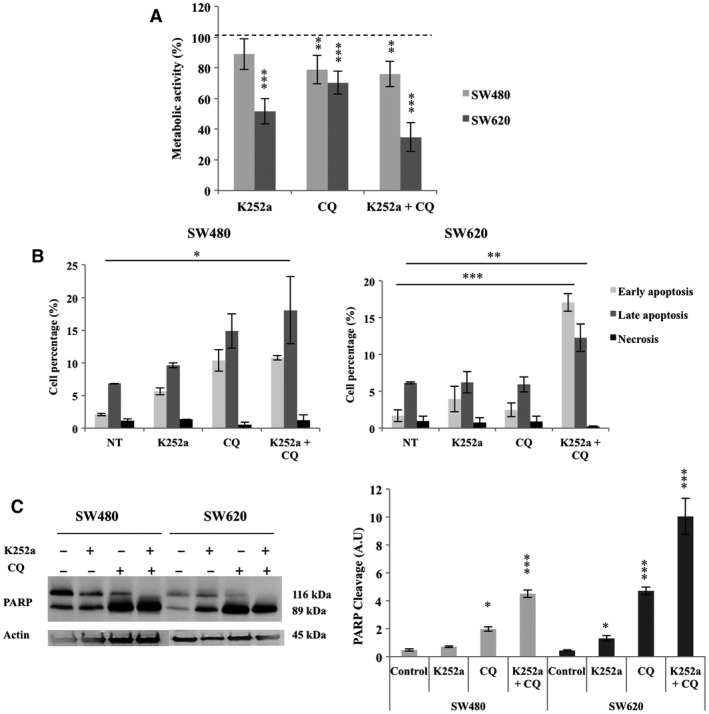
Figure 4.

Metabolic activity, cell death analysis and PARP cleavage in CRC cell lines after K252a, CQ and K252a + CQ treatments. SW480 and SW620 were treated with K252a, CQ or both molecules for 72 hrs (see Materials and methods). (A) Metabolic activity was assessed through MTT testing. Histograms show the means ± S.E.M. of at least three independent experiments (*P < 0.05; **P < 0.01; ***P < 0.001). (B) Apoptosis and necrosis were determined by PI/Annexin‐V‐FITC method with flow cytometry. Histograms show the means ± S.E.M. of at least three independent experiments (*P < 0.05; **P < 0.01; ***P < 0.001). (C) PARP cleavage was assessed by Western blotting. The density of each band representative for protein expression was calculated with ImageJ software. Images show representative results of three experiments. Statistically results are explained in comparison with non treated cells, normalized at 1 (*P < 0.05; **P < 0.01; ***P < 0.001).
