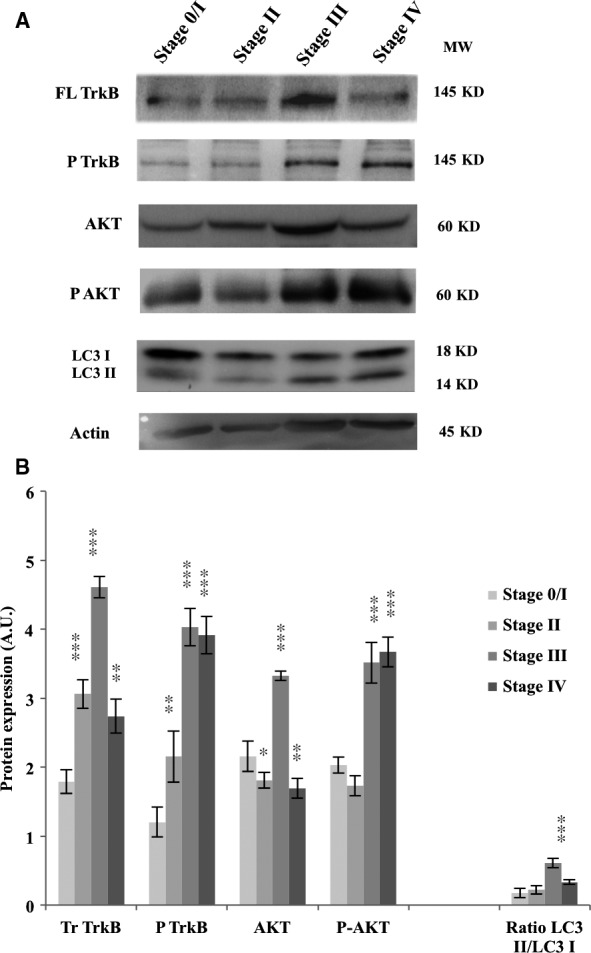
Figure 7.

Neurotrophin and autophagy pathways are active in patients with CRC. Tumour samples from each stage were collected from at least three patients with CRC, lysed and total proteins were extracted. FL TrkB, phospho‐TrkB, AKT, phospho‐AKT and LC3 protein expression was assessed by Western blotting. The density of each band was calculated with ImageJ software. Images show representative results of at least three experiments. Significant differences were obtained by comparison with Stage 0/I, considered as a pre‐cancerous stage (*P < 0.05; **P < 0.01; ***P < 0.001).
