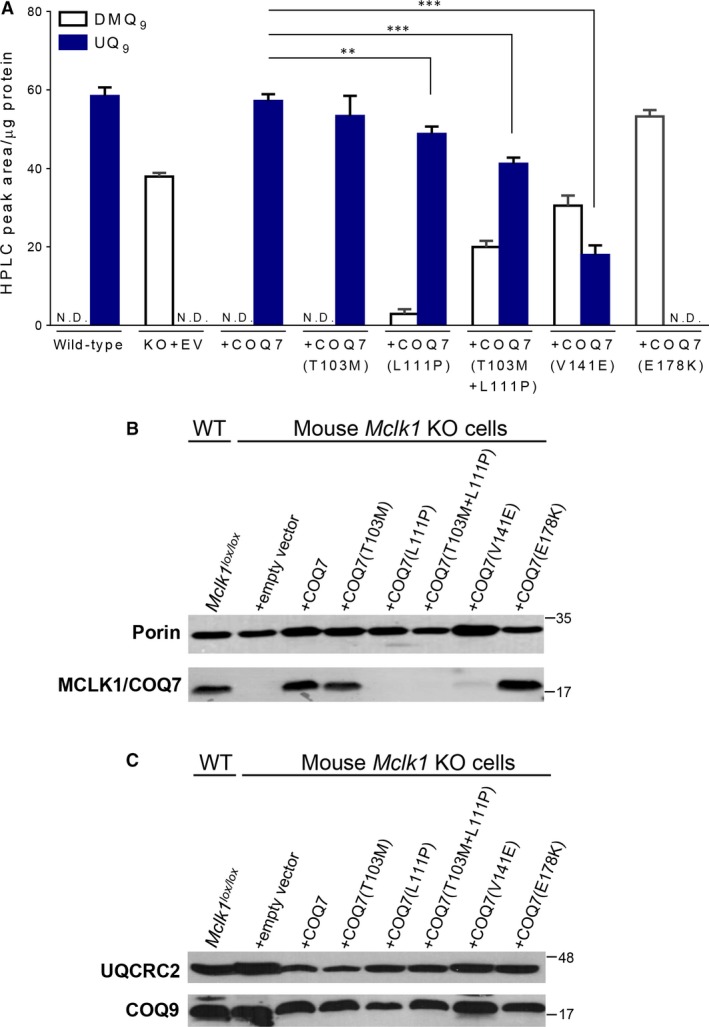
Figure 2.

The pathogenicity evaluation of the patients' mutations in the COQ7 gene (A) UQ levels in the Mclk1/Coq7 KO MEF expressing or not wild‐type or mutated human COQ7. The c.308C>T [p.Thr103Met] (T103M) polymorphism had no significant effect on UQ levels, while the KO cells carrying the c.332T>C [p.Leu111Pro] mutation (L111P) in the transduced COQ7 showed a mild reduction in UQ10 levels and a small amount of DMQ10. L111P, when present together with T103M, reduced the level of UQ to a greater degree than by itself. The c.422T>A [p.Val141Glu] mutation (V141E) resulted in a more severe loss of UQ10 and a larger accumulation of DMQ10 compared with the L111P mutation. No UQ10 was detected in the KO cells expressing COQ7 with the c.532G>A mutation which results in a Glu178Lys (E178K) change corresponding to the C. elegans mutant clk‐1(2519). Quinone levels are expressed as HPLC‐UV peak area normalized to protein content. N.D.: Not detectable. EV: empty vector. Data are mean ± S.E.M. (n = 4–6). **P < 0.01, ***P < 0.001 (Student's t‐test). (B) Western blot analysis of COQ7 levels. The first lane shows MCLK1 in wild‐type control MEFs (mock‐infected Mclk1 lox/lox cells), while the other lanes show the human COQ7 band detected in the Mclk1 KO cells expressing or not wild‐type or mutated COQ7. Extremely low levels of COQ7 were expressed in the KO cells carrying the mutated cDNA of COQ7 that contain the patients' mutations (i.e. L111P, T103M+L111P or V141E). The polymorphism T103M did not significantly affect the COQ7 protein level. Increased COQ7 expression was observed in the KO cells expressing the mutant COQ7 protein with a E178K change. (C) Western blot of COQ9. No significant decrease in mouse COQ9 levels was observed in the cells that have nearly undetectable levels of MCLK1 or COQ7. Western blot was performed on mitochondrial protein extracts and mitochondrial Porin/VDAC and ubiquinol‐cytochrome C reductase core protein II (UQCRC2) were used as loading controls. The migration positions of protein size markers (in kD) are shown on the right. Two Western blots shown were performed on different preparations of mitochondrial proteins. Uncropped Western blot images are shown in Figure S5.
