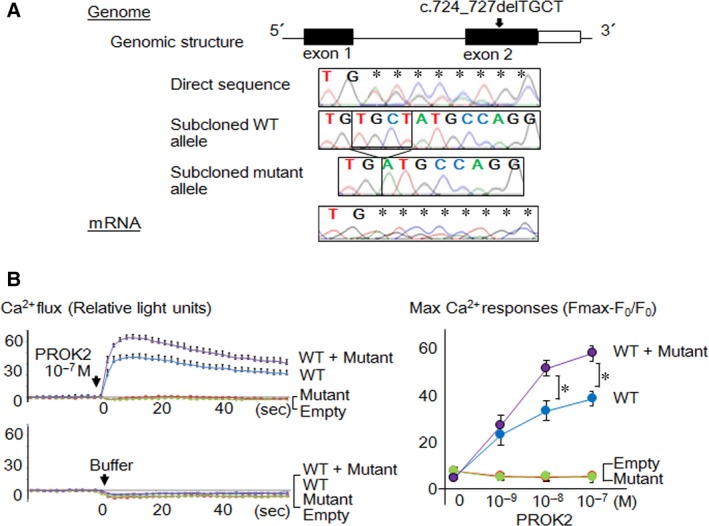
Figure 1.

Identification and characterization of the PROKR2 mutation. (A) Results of the molecular analyses. Black and white boxes in the genomic structure depict coding and non‐coding exons, respectively. The girl carried a heterozygous c.724_727delTGCT mutation in PROKR2 exon 2. RT‐PCR revealed the presence of both wild‐type (WT) and mutant mRNA. (B) Representative results of Ca2+ mobilization assays. The left panel shows Ca2+ flux curves of cells transfected with WT alone (blue lines), mutant alone (green lines), both wild‐type and mutant (WT + Mutant, purple lines), and an empty vector (red lines) (the mean ± 1.0 standard deviation). The cells were treated with 10−7 M PROK2 or buffer (Hank's balanced salt solution plus HEPES buffer). The right panel shows max Ca2+ responses to different doses of PROK2 (0, 10−9, 10−8 and 10−7 M) calculated from the ratio between the change in fluorescence signal intensity (Fmax‐F0) and the baseline intensity (F0). Asterisks indicate significant differences between WT alone and WT + Mutant (P ≤ 0.05).
