
Figure 3.
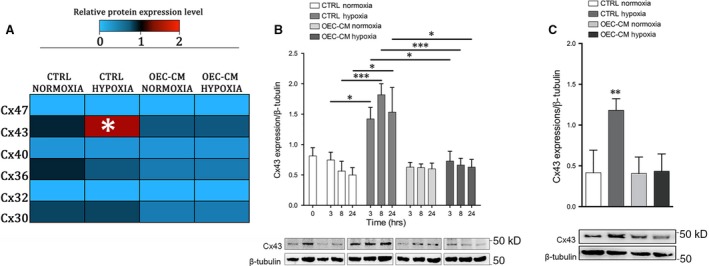
Cxs profile of SH‐SY5Y and SK‐N‐SH cell lines. (A) Heatmap of Cx47, Cx43, Cx40, Cx36, Cx32 and Cx30 protein expression levels on SH‐SY5Y cell line at 24 hrs. Western blots were digitally analysed by integrating the density of each protein band and its corresponding ß‐Tubulin band intensity. Colour key shown for each protein reveals the colour code used to visualise the relative protein expression level, light blue colours correspond to low relative protein expression levels, while red colour correspond to high relative protein expression levels. Average protein expression levels from duplicate cultures were assessed at 24 hrs post‐H/R injury. *P < 0.05 versus CTRL Normoxia. (manovas and Tukey honest significant difference (HSD) post hoc test). (B) Western blot analysis of Cx43 in lysates of SH‐SY5Y normoxic and H/R cultures. Data show the ratio between intensity of Cx43 bands divided by relative ß‐Tubulin bands intensity quantified using imageJ software. Blot shown is representative of three independent experiments. *P < 0,05, ***P < 0.001. (manovas and Tukey honest significant difference (HSD) post hoc test). (C) Western blot analysis of Cx43 in lysates of SK‐N‐SH normoxic and H/R cultures. Data show the ratio between intensity of Cx43 bands divided by relative ß‐Tubulin bands intensity quantified using imageJ software. Blot shown is representative of three independent experiments. **P < 0.01. (manovas and Tukey honest significant difference (HSD) post hoc test).