
Figure 6.
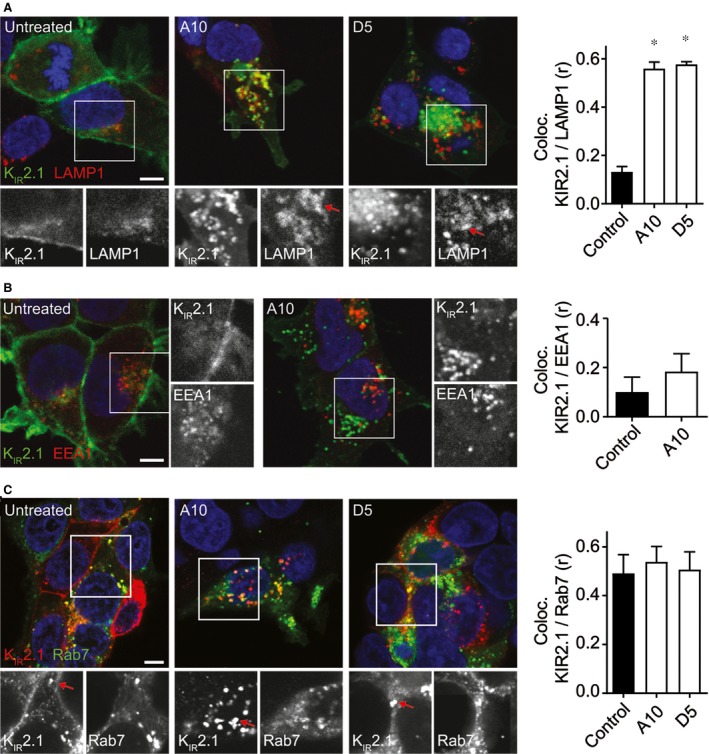
(A) Costaining of KIR2.1‐GFP and LAMP1 in control (untreated) and cells treated with 10 μM amiodarone (A10) or 5 μM dronedarone (D5). Merged pictures are presented in colour. Individual staining patterns of the boxed parts are given in the lower six panels in b/w. Red arrows indicate regions of colocalization. Pearson coefficient of colocalization is presented as bars on the right. (B) Costaining of KIR2.1‐GFP (green) and EEA1 (red) in control (untreated) and cells treated with 10 μM amiodarone (A10). Individual staining patterns of the boxed parts are given in the right panels in b/w. Pearson coefficient of colocalization is presented as bars on the right. (C) Costaining of KIR2.1 (red) and Rab7‐GFP (green) in control (untreated) and cells treated with 10 μM amiodarone (A10) or 5 μM dronedarone (D5). Individual staining patterns of the boxed parts are given in the lower six panels in b/w. Pearson coefficient of colocalization is presented as bars on the right. Scale bars represent 5 μm. *P < 0.05.