
Figure 7.
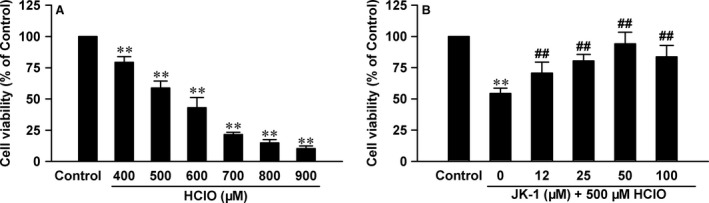
Effects of JK‐1 on HClO‐induced cellular injury in GES‐1 cells. (A) The cells were exposed to increasing concentrations of HClO ranging from 400 to 900 μM for 24 hrs. (B) Before the exposure to 500 μM HClO for 24 hrs, the cells were pre‐treated with various concentrations of JK‐1 for 1 hr. At the end of treatments, cell viability was measured by CCK‐8 assay. Data were shown as mean ± S.D. n = 5. **P < 0.01 versus control group, ##P < 0.01 versus HClO alone group.