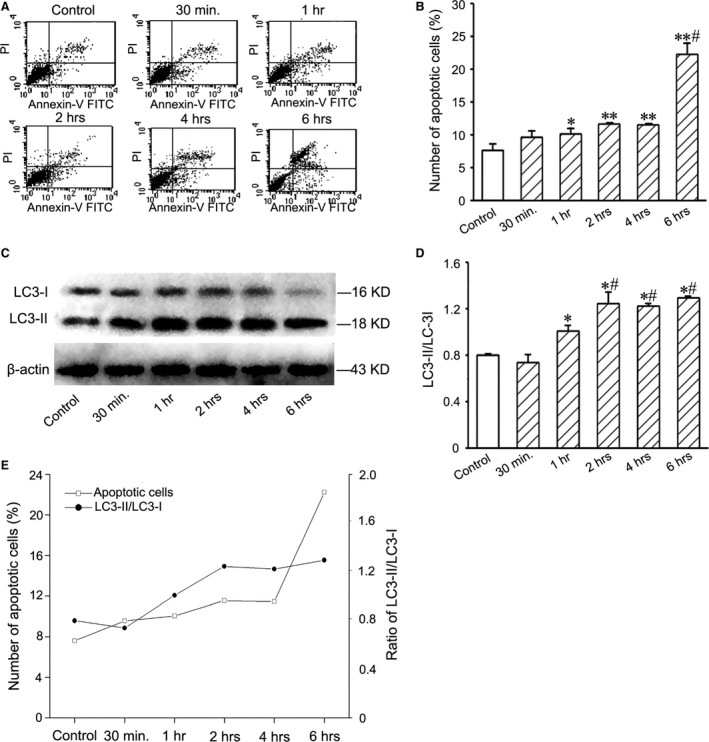
Figure 2.

Apoptosis and LC3 expression of EPCs after treatment with 1% O2. (A) Typical quadrantal diagrams of flow cytometric analysis of the apoptotic cells. (B) Statistic result of numbers of the apoptotic cells. After hypoxia treatment, the number of the apoptotic cells increases. *P < 0.05 and **P < 0.01 versus control group, #P < 0.05 versus hypoxia 30 min., 1, 2 and 4hrs groups. (C) Western blotting of LC3 in the cells. The levels of LC3‐II expression in the hypoxic cells increased. (D) Statistic result of LC3‐II/LC3‐I ratios. At 2 hrs after hypoxia treatment, LC3‐II/LC3‐I ratio reaches the plateau. *P < 0.05 versus control group, #P < 0.05 versus hypoxia 30min. and 1hr groups. (E) The curves of the numbers of the apoptotic cells and LC3‐II/LC3‐I ratios after hypoxia treatment. EPC: endothelial progenitor cells.
