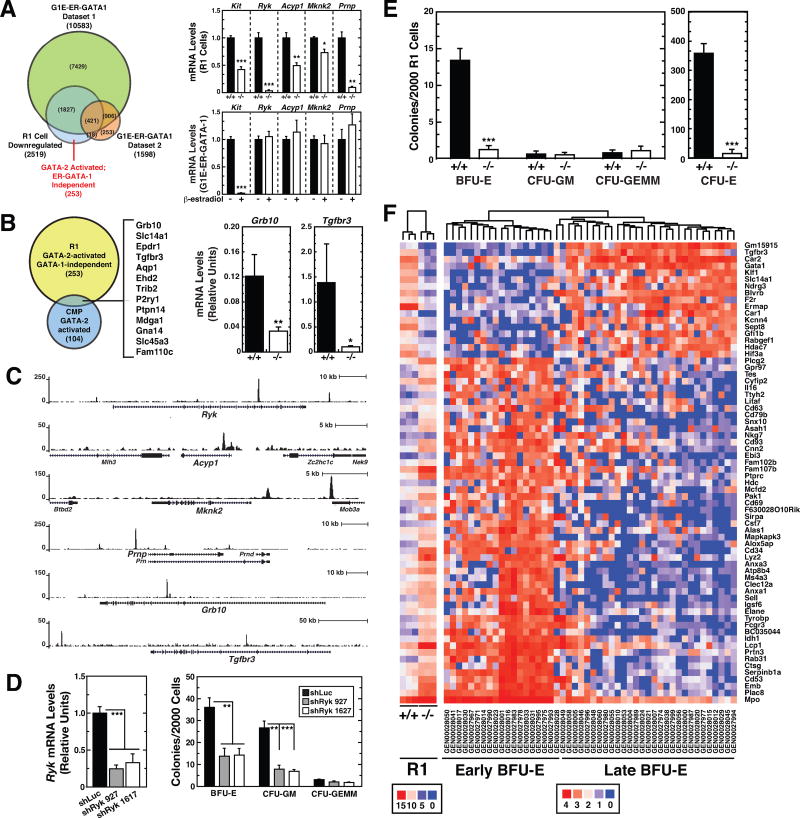
Figure 6. −77 Gata2 Enhancer Requirement for Burst Forming Unit-Erythroid.
(A) Venn diagram depicting overlap between genes regulated by GATA-1 in G1E-ER-GATA-1 cells and by the −77 enhancer in R1 cells. Changes in R1 cell RNA-seq read counts are shown for representative GATA-2-activated genes. Also shown are the relative mRNA levels of these genes in G1E-ER-GATA-1 cells with and without β-estradiol treatment. G1E-ER-GATA-1 Dataset 1; Gene expression changes following 48 h induction of GATA-1 activity by β-estradiol quantified by RNA-seq. G1E-ER-GATA-1 Dataset 2; Gene expression changes following 24 h induction of GATA-1 activity by β-estradiol. Transcripts were quantified by Agilent-028005 SurePrint G3 Mouse GE 8×60K Microarray (Pope and Bresnick, 2013).
(B) Venn diagram depicting overlap between GATA-2-activated genes in R1 cells and CMPs (GSE69786). Genes common to both categories are listed. Reductions in Grb10 and Tgfbr3 mRNA expression in −77−/− R1 cells were confirmed by qRT-PCR (−77+/+ [n = 4]; −77−/− [n = 6]).
(C) GATA-2 ChIP-seq profiles in GATA-1-null G1E erythroid precursor cells mined from dataset GSM722387.
(D) CFU activity of lineage-depleted E14.5 fetal liver cells following shRNA-mediated knockdown of Ryk. Ryk mRNA was quantified by qRT-PCR 3 days post-infection with control (shLuc) or Ryk shRNA-exressing retrovirus. 2000 cells were plated in methylcellulose within 16 h post-infection. Colonies were enumerated on day 8 (n = 6). (E) CFU activity of E14.5 fetal liver R1 cells quantified after 2 (CFU-E) or 8 (BFU-E, CFU-GM and CFU-GEMM) days in methylcellulose. Graphs show mean ± SEM; *p < 0.05, **p < 0.01, ***p < 0.001. Significance was analyzed using the 2-tailed unpaired Student’s t test.
(F) Cluster analysis of −77+/+ and −77−/− R1 gene expression and comparison with “early” and “late” BFU-E gene expression signature (Gao et al., 2016).

