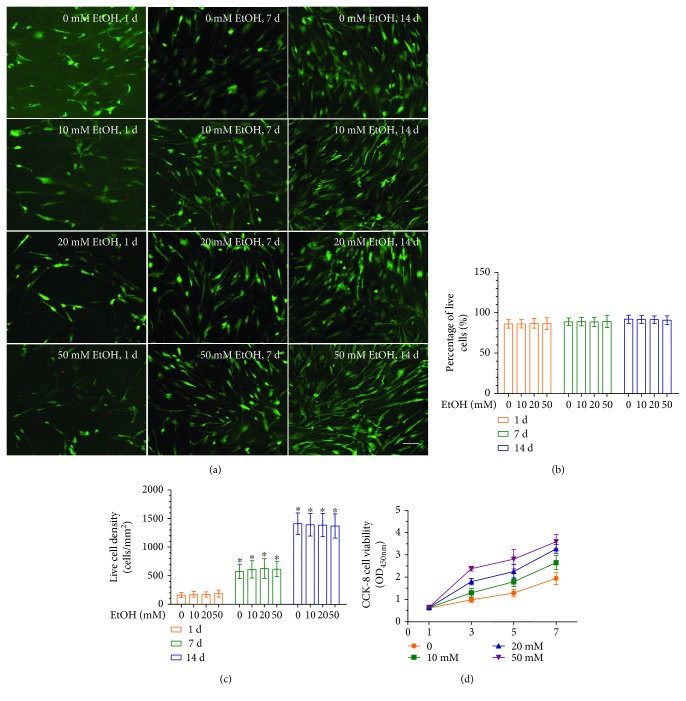
Figure 2.
Effect of EtOH on cell viability and proliferation of DPCs. (a) Representative live/dead images of EtOH-treated DPCs after days 1, 7, and 14 of culture. Live cells were stained in green and dead cells were stained in red. In all four groups, live cells were abundant, and dead cells were few (scale bar = 50 μm). (b) Percentage of live cells of DPCs was around 90%. Data represent mean ± SD of 3 experiments with triplicates. (c) EtOH increased the cell proliferation. Data represent mean ± SD of 3 experiments with triplicates. ∗p < 0.05 versus control group.

