
Figure 7.
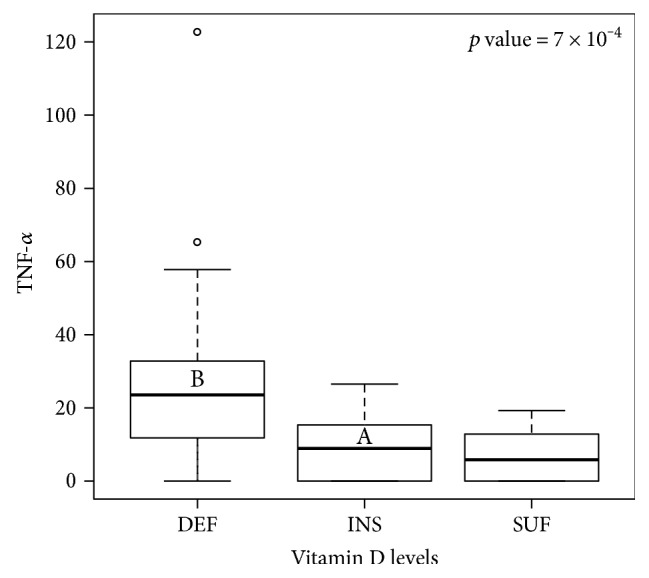
Relation of TNF-α with vitamin D. Concentrations of TNF-α are plotted against the 25(OH)D level. The bold line represents the median, the box encloses the first and third quartiles, and the whiskers, the minimum and maximum value; points are outliers (still considered in the statistical analysis). Letters denote statistical difference between groups resulting from Tukey's all pair comparisons (p < 0.05). DEF = deficiency; INS = insufficiency; SUF = sufficiency.