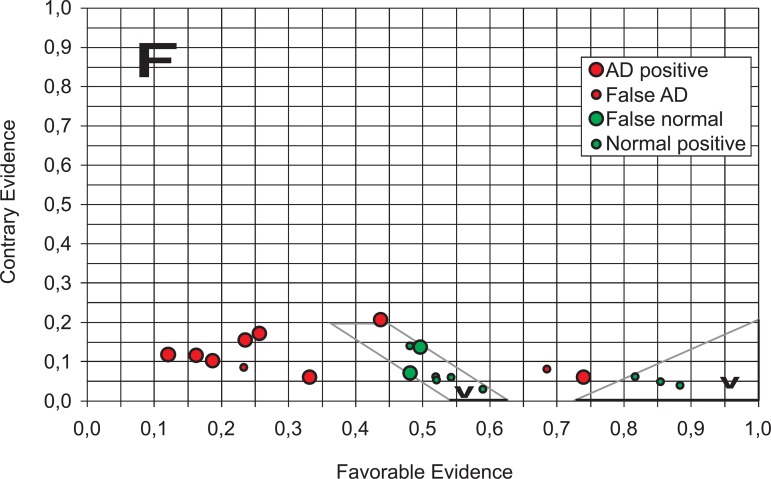
Figure 5.
Final lattice of diagnosis decision states – Normal x Probable AD patients. We can observe two groups of normality: those non AD patients with Alpha concentration higher or equal to the average rate population (triangle of right side) and remaning non AD patients with Alpha concentration lower than average population rate. F, false output state; V, true output state.

