
Figure 1. Model 4 Growth in BMI Disparities over 16 Years between Black and White Women.
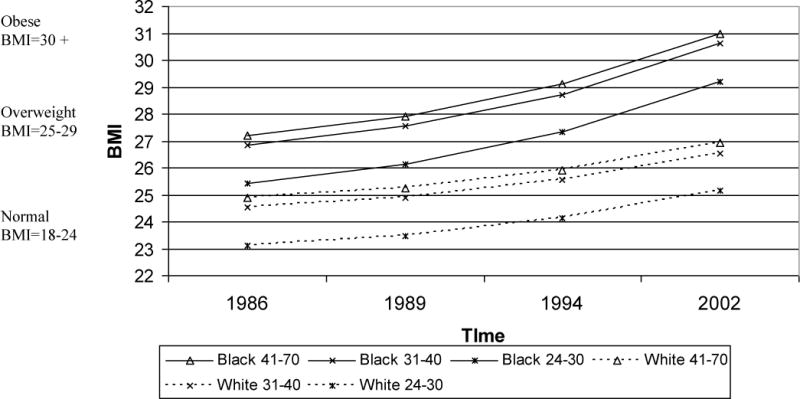
Note: Model 4 controls for the following variables: Black (and interacted with time), time, age, neighborhood disadvantage (and interacted with time),, percent Black, percent Black*time, education, Marital status, number of children (and interacted with time), had baby last year (and interacted with time), family income (and interacted with time), assets (and interacted with time), smoker status (and interacted with time), physical activity (and interacted with time), social support (and interacted with time), financial strain (and interacted with time), and acute stress (and interacted with time).