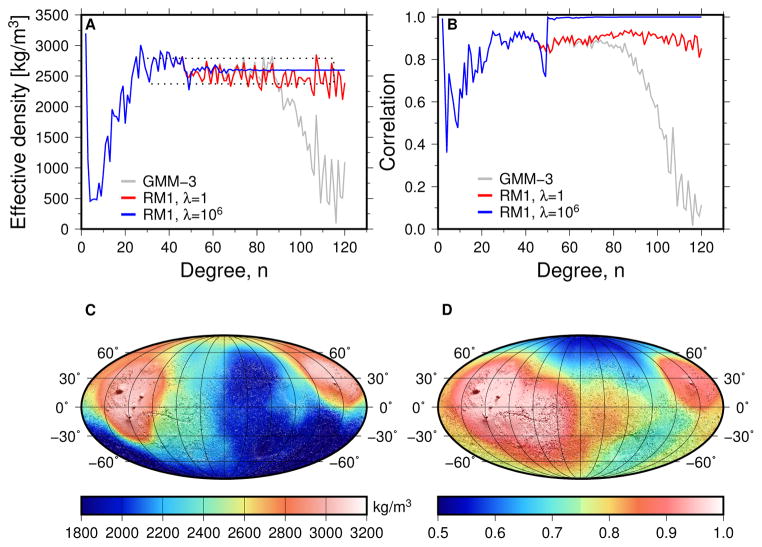
Figure 2.
(A) Effective density for the Mars model GMM-3, and for models using our constraint with different damping parameters. The dashed box indicates the minimum and maximum of the estimated density taken from the estimated errors, and the degree range over which the averaging was done. (B) Correlations between gravity and gravity-from-topography for the same Mars gravity models. (C) An example of how density on Mars can vary laterally, computed from localized effective density spectra averaged between degrees n = 50 and n = 85, using our degree and order 150 RM1 model based on GMM-3 data (See Supplementary Information). (D) Localized correlations between gravity and gravity-from-topography. The maps are in Mollweide projection centered on the prime meridian, shaded by topography.

