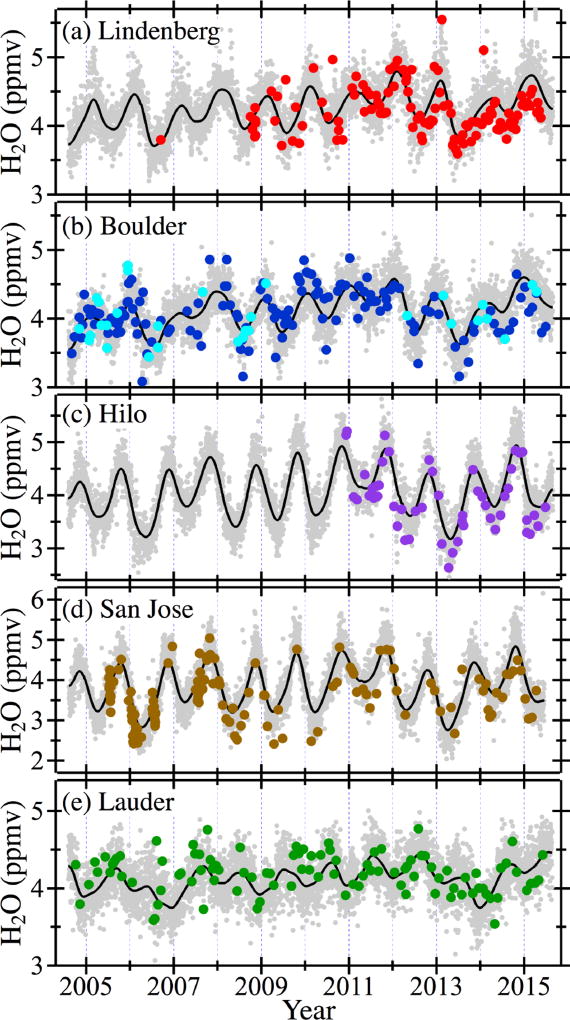
Figure 1.
Daily average MLS version 3.3 overpass retrievals (gray markers, smoothed black curves) and in situ frost point hygrometer (FP) data at 68 hPa for individual soundings at each site (filled circles). Data from two types of FPs are shown: NOAA FPH at Boulder (dark blue), Hilo and Lauder, and CFH at Lindenberg, Boulder (cyan) and San Jose. Note the emerging biases between FP and MLS mixing ratios at all five sites towards the ends of their records.

