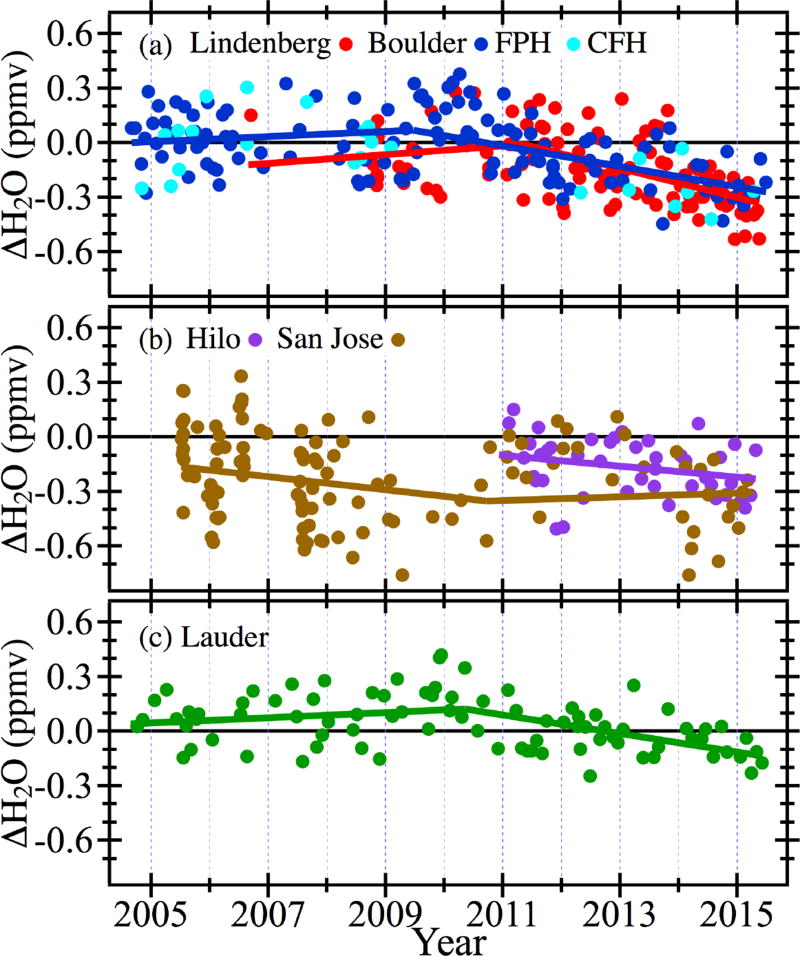
Figure 2.
Differences between FP mixing ratios and spatiotemporally coincident MLS v3.3 water vapor retrievals at 68 hPa over the five FP sounding sites. In the top panel (a) dark blue and cyan markers for Boulder depict soundings made with the NOAA FPH and the CFH, respectively. Lines show the trends in FPH–MLS differences in two distinct periods separated by a changepoint, except for Hilo where the shorter FP records show no indications of statistically significant changepoints.

