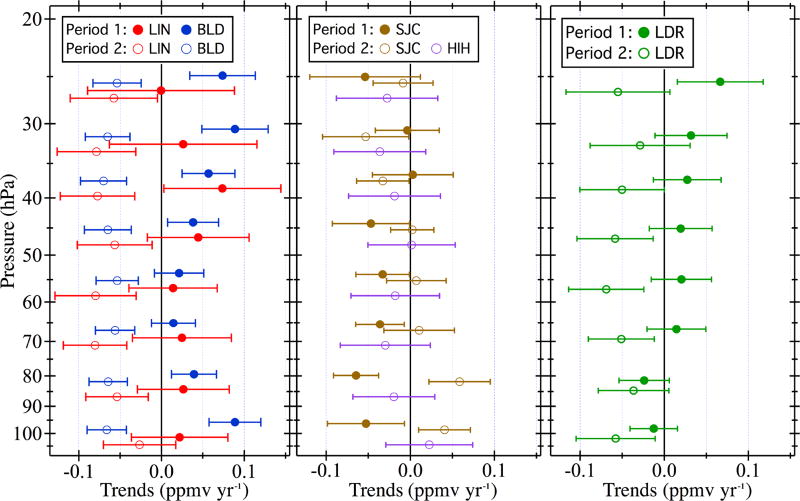
Figure 3.
Trends in FP–MLS differences for the pre- and post-changepoint periods at eight stratospheric pressure levels (100–26 hPa) over the five FP sounding sites. Markers for each pressure level are slightly offset in pressure for clarity. Horizontal error bars depict the 95% confidence intervals of the trends. Only period 2 trends are shown for Hilo because the shorter records show no indications of statistically significant changepoints.

