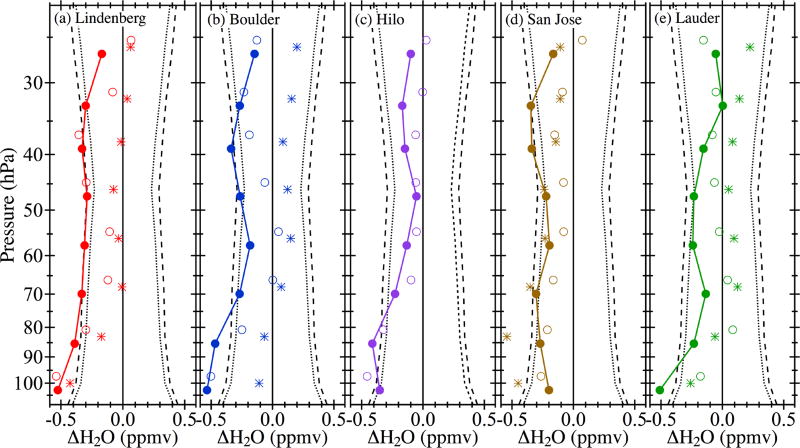
Figure 5.
FP–MLS v3.3 differences at the starting points (open circles), changepoints (asterisks) and ending points (filled circles) of the time series as defined by piecewise continuous linear fits. Colored vertical curves join the ending points to serve as visual guides. Black vertical curves depict the combined accuracy estimates for FP and MLS measurements of stratospheric water vapor based on FP accuracy values of 3% (dotted) and 5% (dashed). Note that many of the ending point values lie near or outside the combined accuracy estimates. For Hilo only the starting and ending point differences are presented because no significant changepoints were detected in the shorter records.

