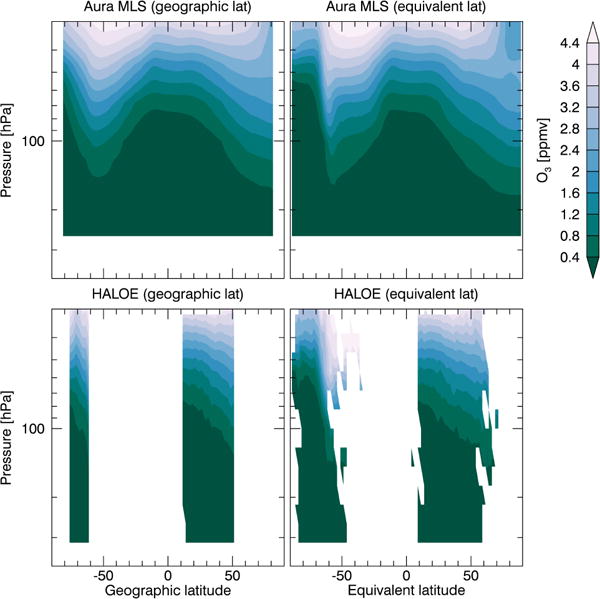
Figure 10.

Ozone height vs. latitude plots on geographic latitude (left column) and equivalent latitude grids (right column), for October 2004. Increased data coverage and increased depth of Antarctic ozone depletion are apparent in the equivalent latitude gridded data.
