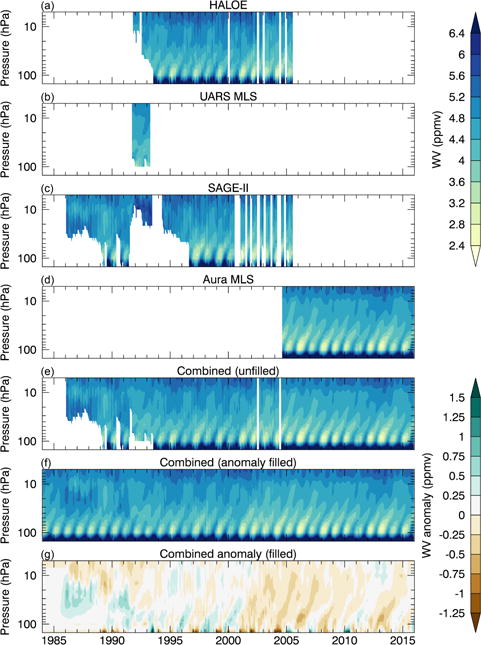
Figure 12.

The tropical average (30° S–30° N) water vapor concentration as a function of height and time, which is commonly referred to as the “tropical tape recorder”, for each satellite data set in SWOOSH (a–d), as well as the two combined products (e–f) and the combined (filled) anomaly product (g). SAGE III data are non-existent in the tropics and therefore not included.
