Figure 13.

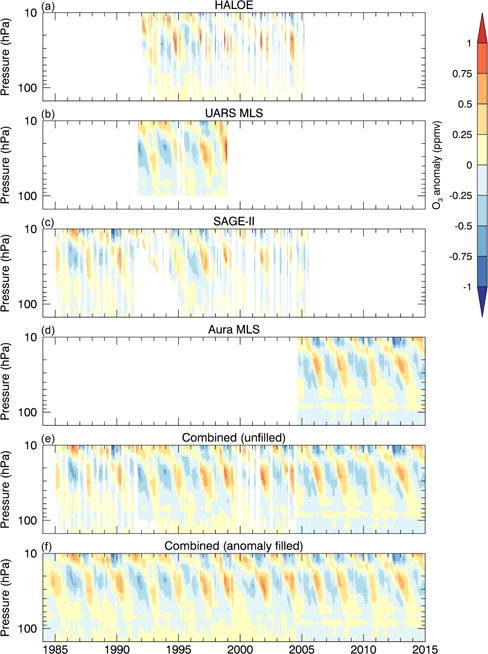
The tropical average (10° S–10° N) ozone concentration anomaly as a function of height and time for each satellite data set in SWOOSH (a–d), as well as the two combined products (e–f).

The tropical average (10° S–10° N) ozone concentration anomaly as a function of height and time for each satellite data set in SWOOSH (a–d), as well as the two combined products (e–f).