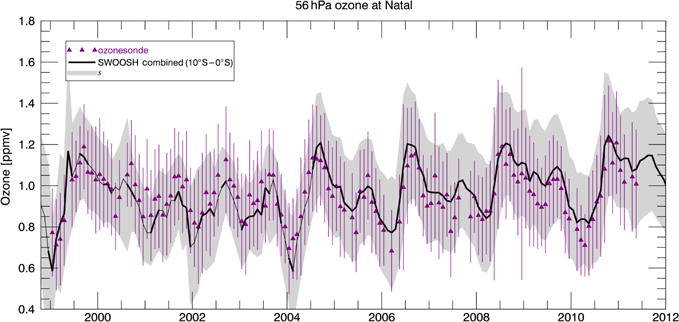
Figure 14.

The Natal, Brazil (5° S, 35° W), ozonesonde monthly means in a 2 km layer centered on 56 hPa (purple triangles). Error bars show the 95 % confidence interval for the ozonesondes data. Also shown are the SWOOSH combined O3 zonal-mean data for the 10–0° S band. The light gray shading is twice the SWOOSH combined standard deviation product described in the text.
