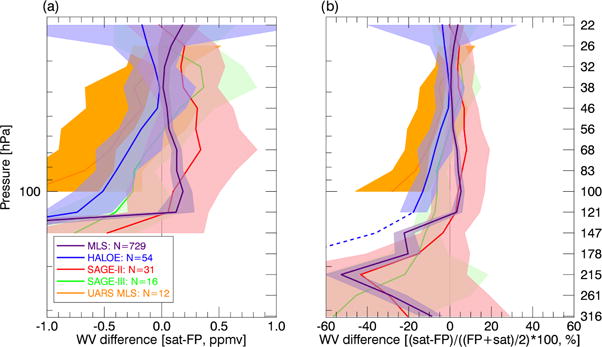
Figure 3.

The difference as a function of height between matched satellite and balloon frost point (FP) hygrometer water vapor (WV) data, expressed (a) as a mixing ratio difference and (b) as a percent difference between the mean value at each level (see discussion in Sect. 3.1). The number of matches at 82 hPa is shown in the legend, and the mean difference (solid) and ±2 standard error range (shaded) are shown at each level. The dashed blue line shows the HALOE data that are excluded from SWOOSH, at and below 147 hPa.
