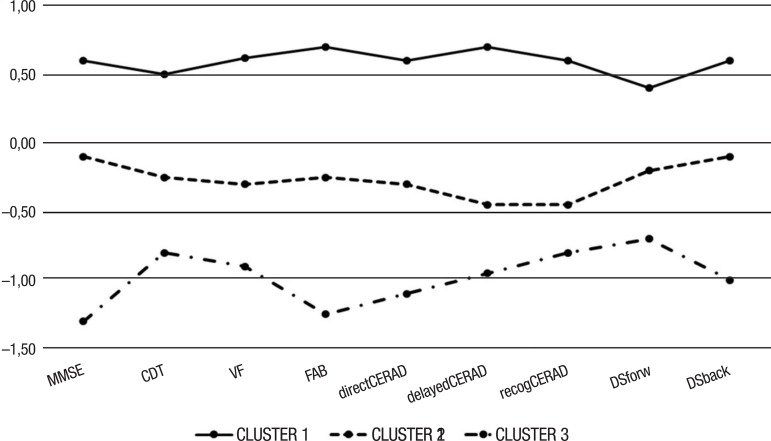
Figure 1.
Graph illustrating z-score of each cluster in each cognitive test. The black line represents cluster 1, comprising PD-MCI patients (59%) and PDNC (41%) patients. This group had better cognitive performance than the other groups, with z-scores higher than the others on all tests. The dashed line represents cluster 3, comprising only patients with PDD and showing lower z-scores than the other groups on all tests. The dotted line represents cluster 2, comprising patients with PDD (60.5%), PD-MCI (34.2%) and PDNC (5.3%). This group had intermediate z-scores compared to the other 2 groups.

