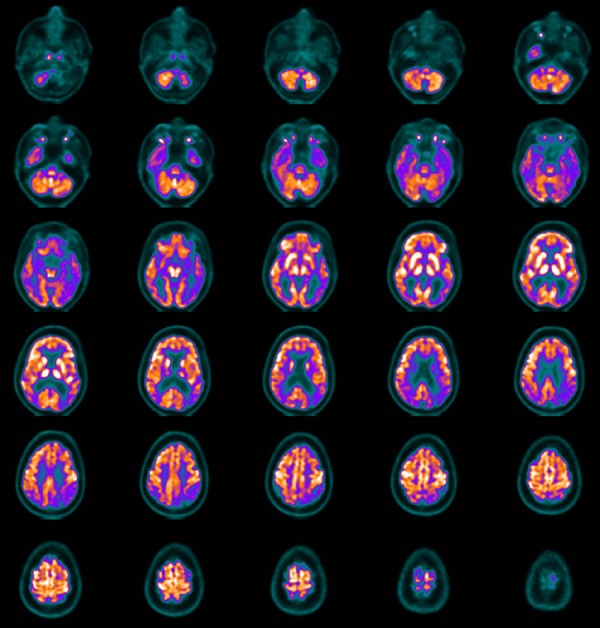
Figure 2.

FDG-PET of a patient with Alzheimer's disease. Transversal slices show marked hypometabolism in the posterior cingulate cortex and posterior temporoparietal association cortex. Note the difference in glucose metabolism of the posterior portions of the brain compared to the frontal lobes.
