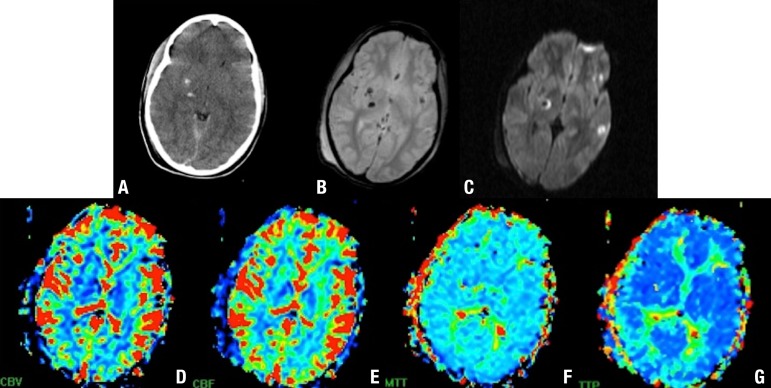
Figure 7.
DAI involving the basal ganglia and gray-white matter junction. Axial CT [A], T2 GRE [B] and DWI [C] show hemorrhagic DAI lesions. Perfusion (dynamic susceptibility contrast) MR imaging cerebral blood volume (CBV) [D], cerebral blood flow (CBF) [E], mean transit time (MTT) [F], and time to peak (TTP) [G] maps show low perfusion at the level of the basal ganglia.

