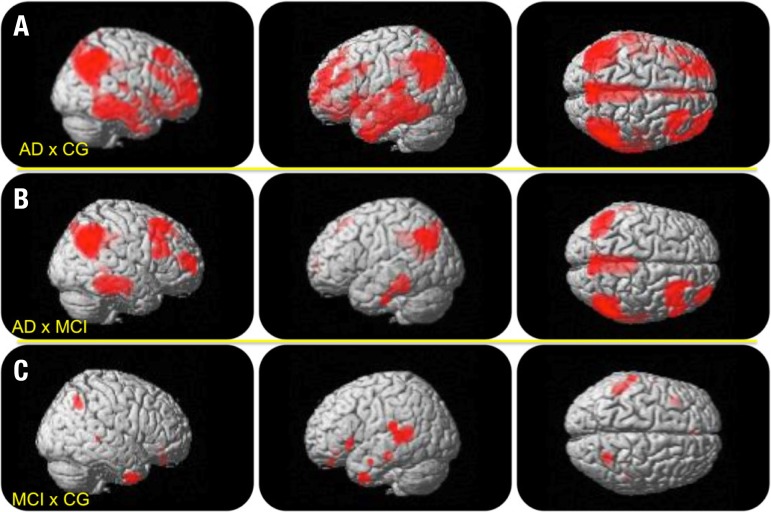
Figure 2.
Illustrative anatomic location of peak voxels of rBGM reductions as measured by [18F]FDG-PET. [A] (upper row): areas of rBGM reduction in the AD group versus the CG in large areas of the temporoparietal cortex, posterior cingulate and prefrontal cortex; [B] (middle row): areas of rBGM reduction in the AD group versus the MCI group, showing hypometabolism in similar areas seen in A, albeit with lesser extension and intensity; [C] areas of rBGM reduction in the MCI group versus CG, restricted to the temporal lobes and temporo-parietal association cortex, without significant changes in the PCC.

