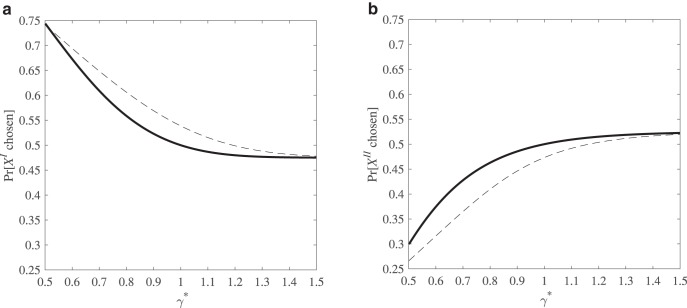
Figure 2.
a and b. The probability of choosing a low-probability risky gamble XI over its expected value YI (left panel) and the probability of choosing a high-probability risky gamble XII over its expected value YII (right panel) for varying values of γ*. These figures are plotted with only response noise (solid line) and with both response and preference noise (dashed line).

