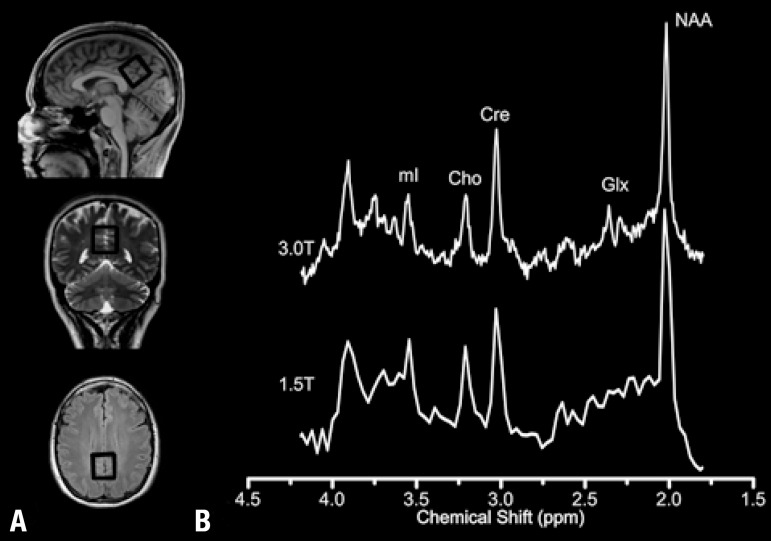
Figure 1.
[A] Schematic representation of the voxel location used for localized MRS data acquisition, which is, due to chemical shift effects, a representation of the voxel location of the NAA signal. [B] Typical spectra obtained from a representative volunteer at 1.5T and 3.0T showing the common brain metabolites.

