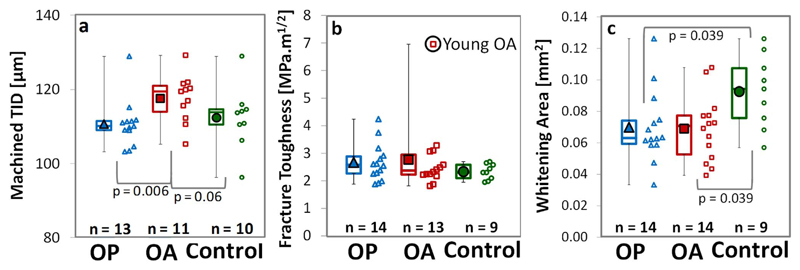
Fig. 6.
Comparison between donors in the osteoporotic fracture (OP), osteoarthritic THR (OA) and control groups in terms of a) indentation distance (TID), b) fracture toughness (Kmax) and c) maximum whitening area (WArea) with p values displayed where significant (p < 0.05) or close to significance (p < 0.1). The young osteoarthritic donor is considered anomalous and has been excluded from the analysis.

