
Figure 11.
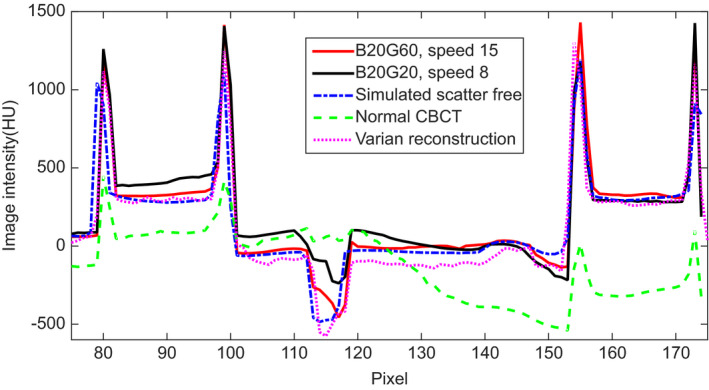
Comparison of the horizontal profile, as indicated by a dashed line in Fig. 10(b), for simulated non blocker and scatter free image, scatter contaminated CBCT, and scatter corrected CBCT images with two different moving blockers and with Varian software in Figs. 10(a)–10(e), respectively.